Excel Data Analyst Resume Examples

Jul 18, 2024
|
12 min read
Unleash your inner 'number cruncher' with these tips on crafting an Excel data analyst resume. Build an impressive resume that highlights your skills in data analysis and boosts your chances of landing that dream job.
Rated by 348 people
- •Led a team of 5 analysts to integrate datasets from multiple sources, improving data accuracy by 20%.
- •Developed interactive dashboards using Tableau, increasing report accessibility and reducing decision-making time by 15%.
- •Conducted data quality assessments and implemented data cleansing processes, resulting in a 25% reduction in operational costs.
- •Designed and executed SQL queries to extract actionable insights from a database of over 1 million records.
- •Collaborated with sales and engineering teams to create custom data reports, boosting process efficiency by 18%.
- •Devised data storage frameworks that improved data retrieval speed by 30%, enhancing the user experience for internal stakeholders.
- •Spearheaded data integration projects that resulted in a unified data warehouse, reducing data silos by 40%.
- •Performed complex data analysis and produced reports for management, aiding in a 12% increase in operational efficiency.
- •Implemented statistical models and algorithms to predict market trends, improving sales forecasting accuracy by 25%.
- •Optimized data processing techniques, cutting down data retrieval time by 35%.
- •Collaborated with engineering teams to align data analytics initiatives with business goals, achieving a 10% improvement in KPIs.
- •Designed and maintained Excel-based dashboards that provided critical insights and supported data-driven decision making.
- •Conducted data audits and validations, resulting in the identification and rectification of inaccuracies, improving data integrity by 30%.
- •Developed and maintained automated data pipelines that maintained a consistent flow of information across departments.
- •Collaborated with cross-functional teams to identify data needs, resulting in customized reporting solutions for sales and marketing.
- •Assisted in data collection and analysis for various projects, contributing to a 15% increase in project completion speed.
- •Generated routine and ad-hoc reports that streamlined business processes and improved decision-making capabilities.
- •Conducted quantitative analysis to assess business performance and provided key metrics to senior management.
- •Implemented data visualization techniques that enhanced the clarity and effectiveness of reports for stakeholders.

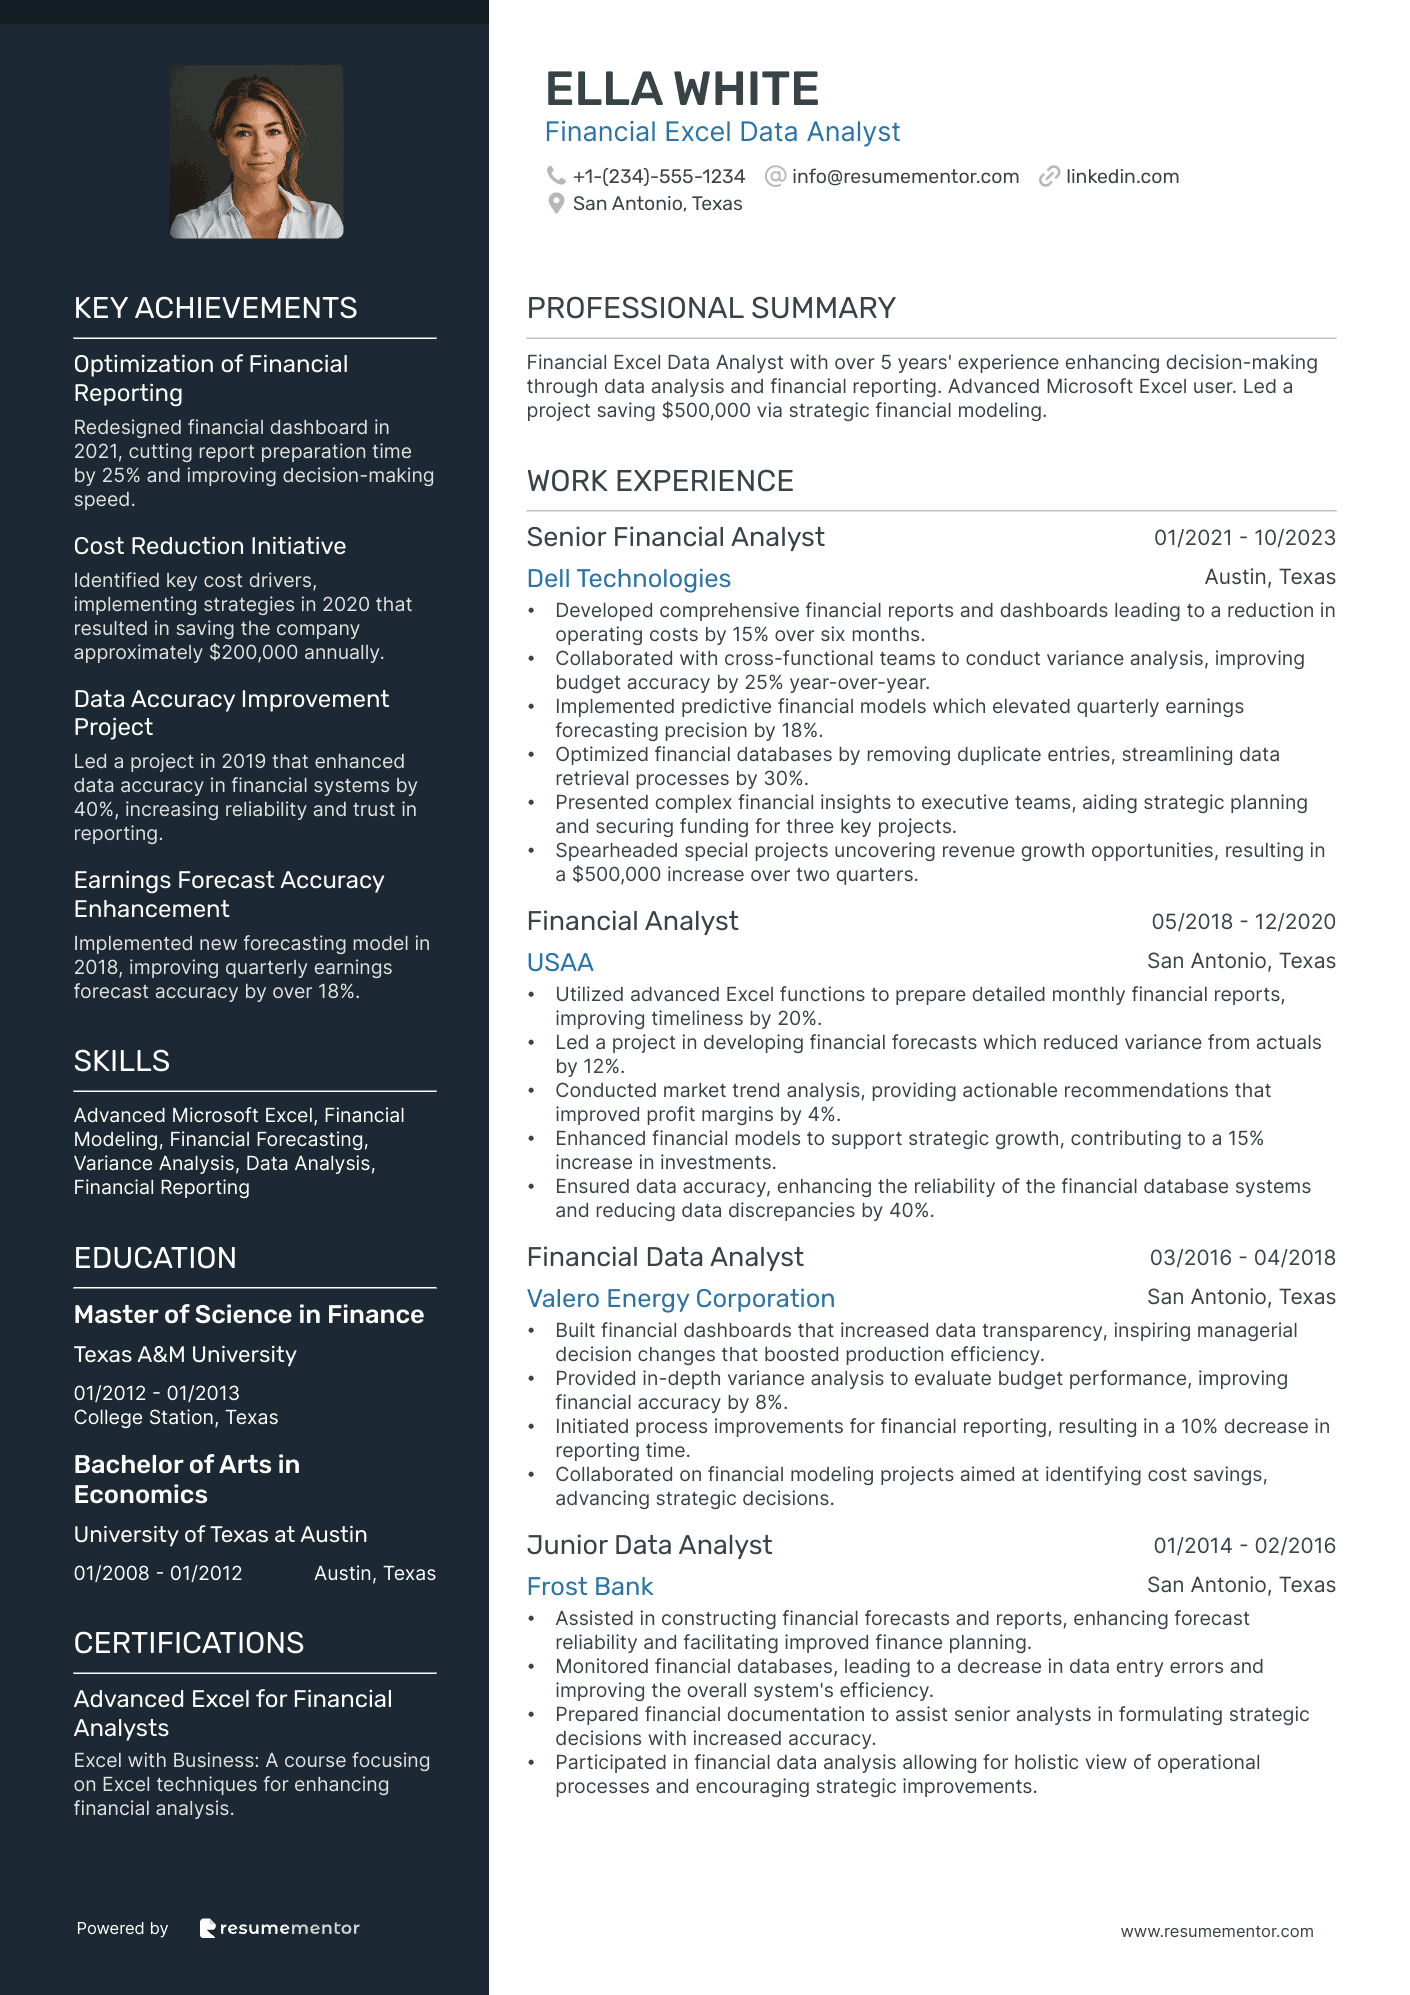
Financial Excel Data Analyst
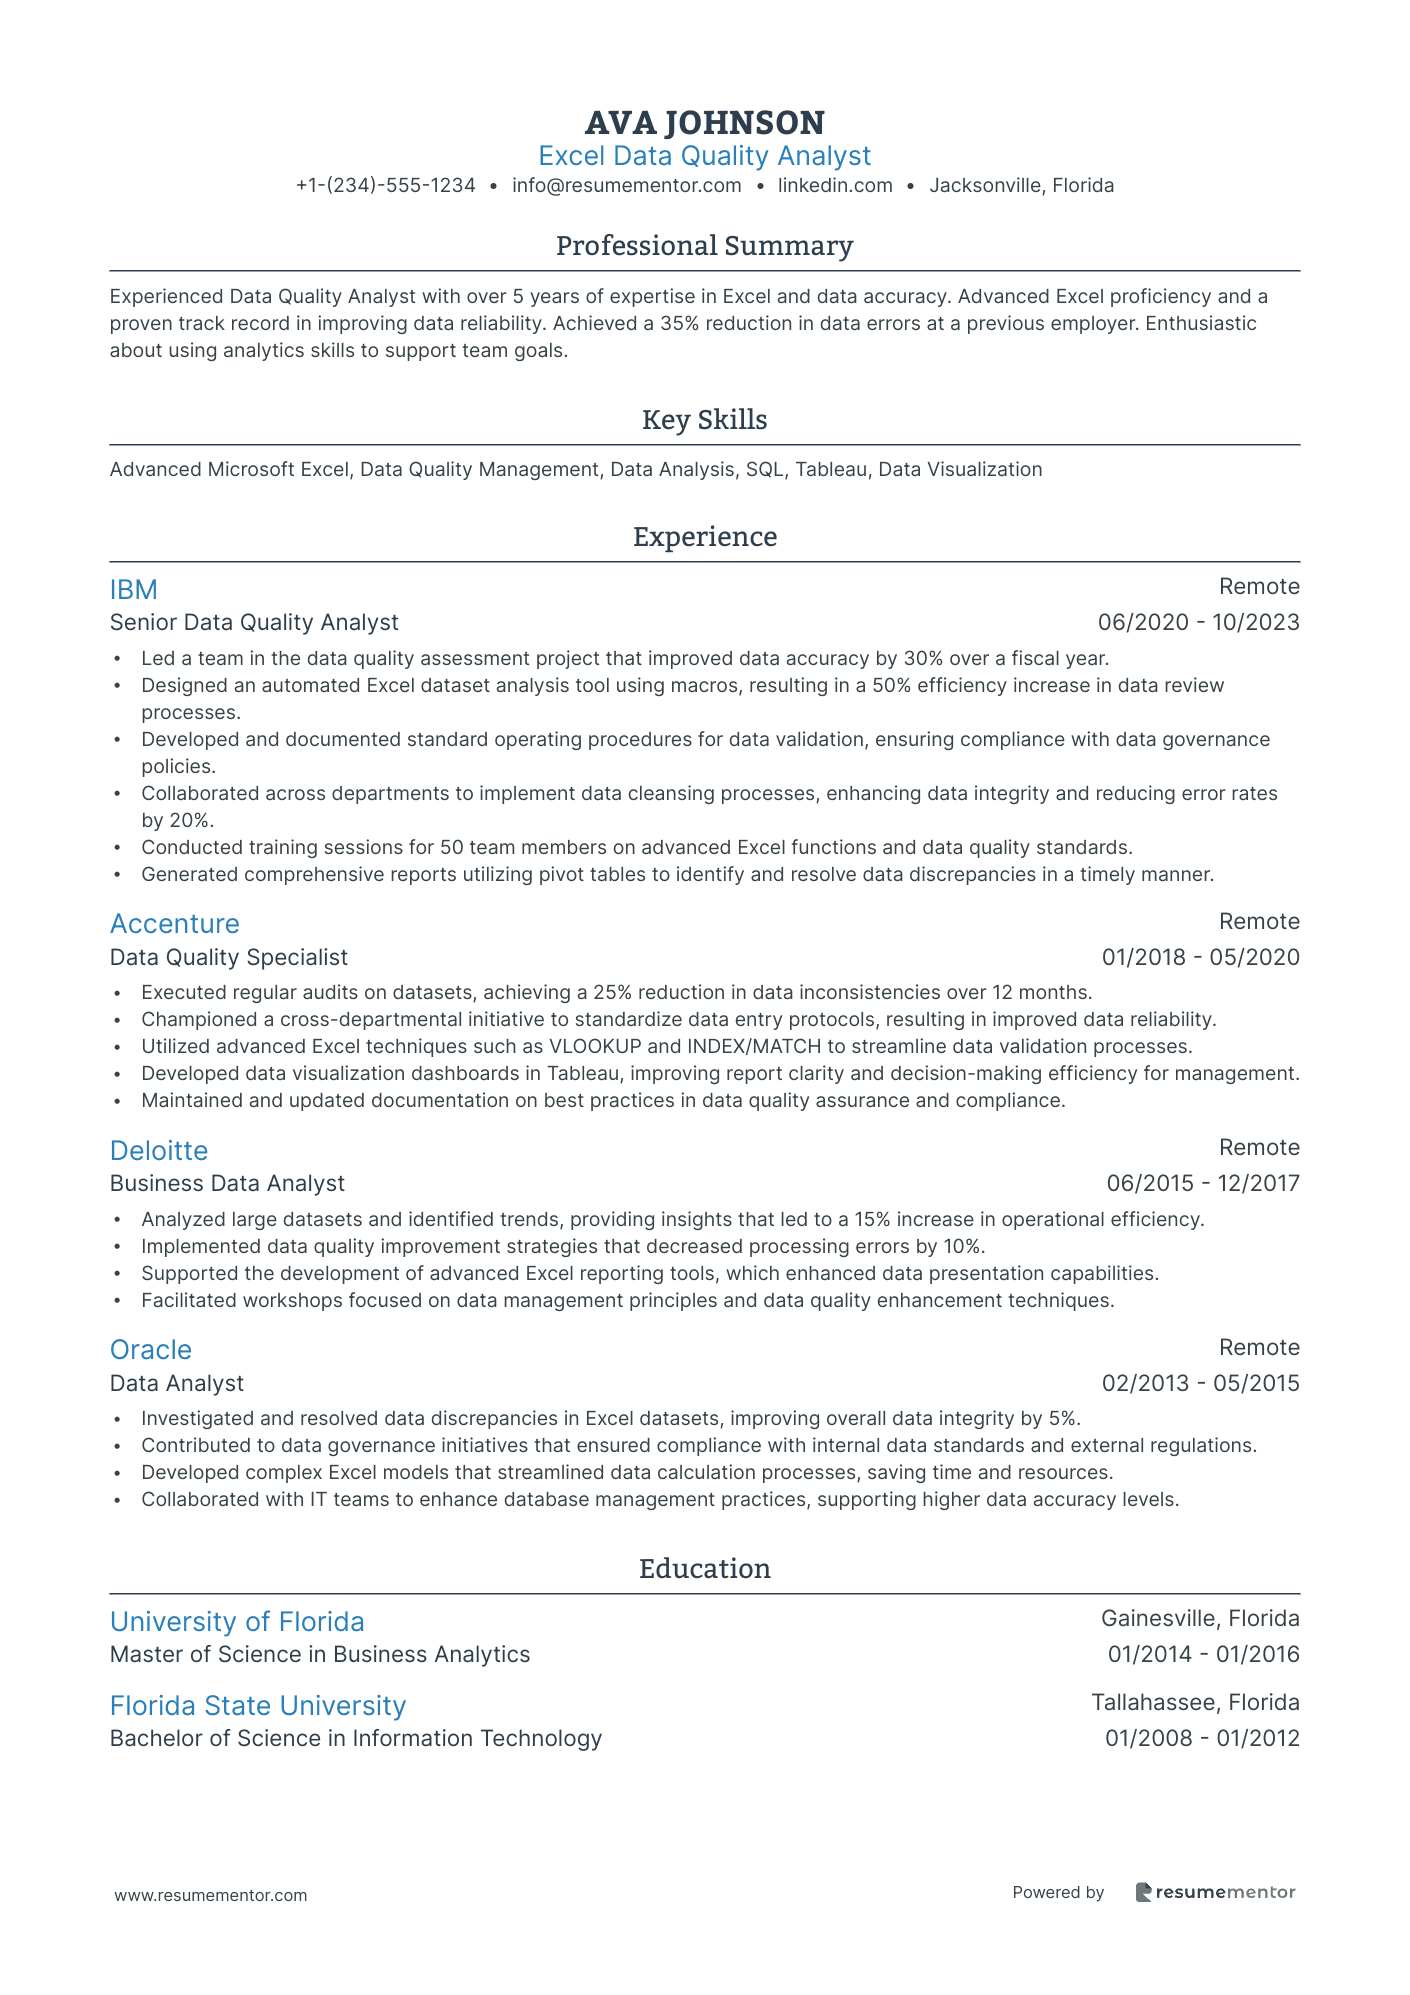
Excel Data Quality Analyst
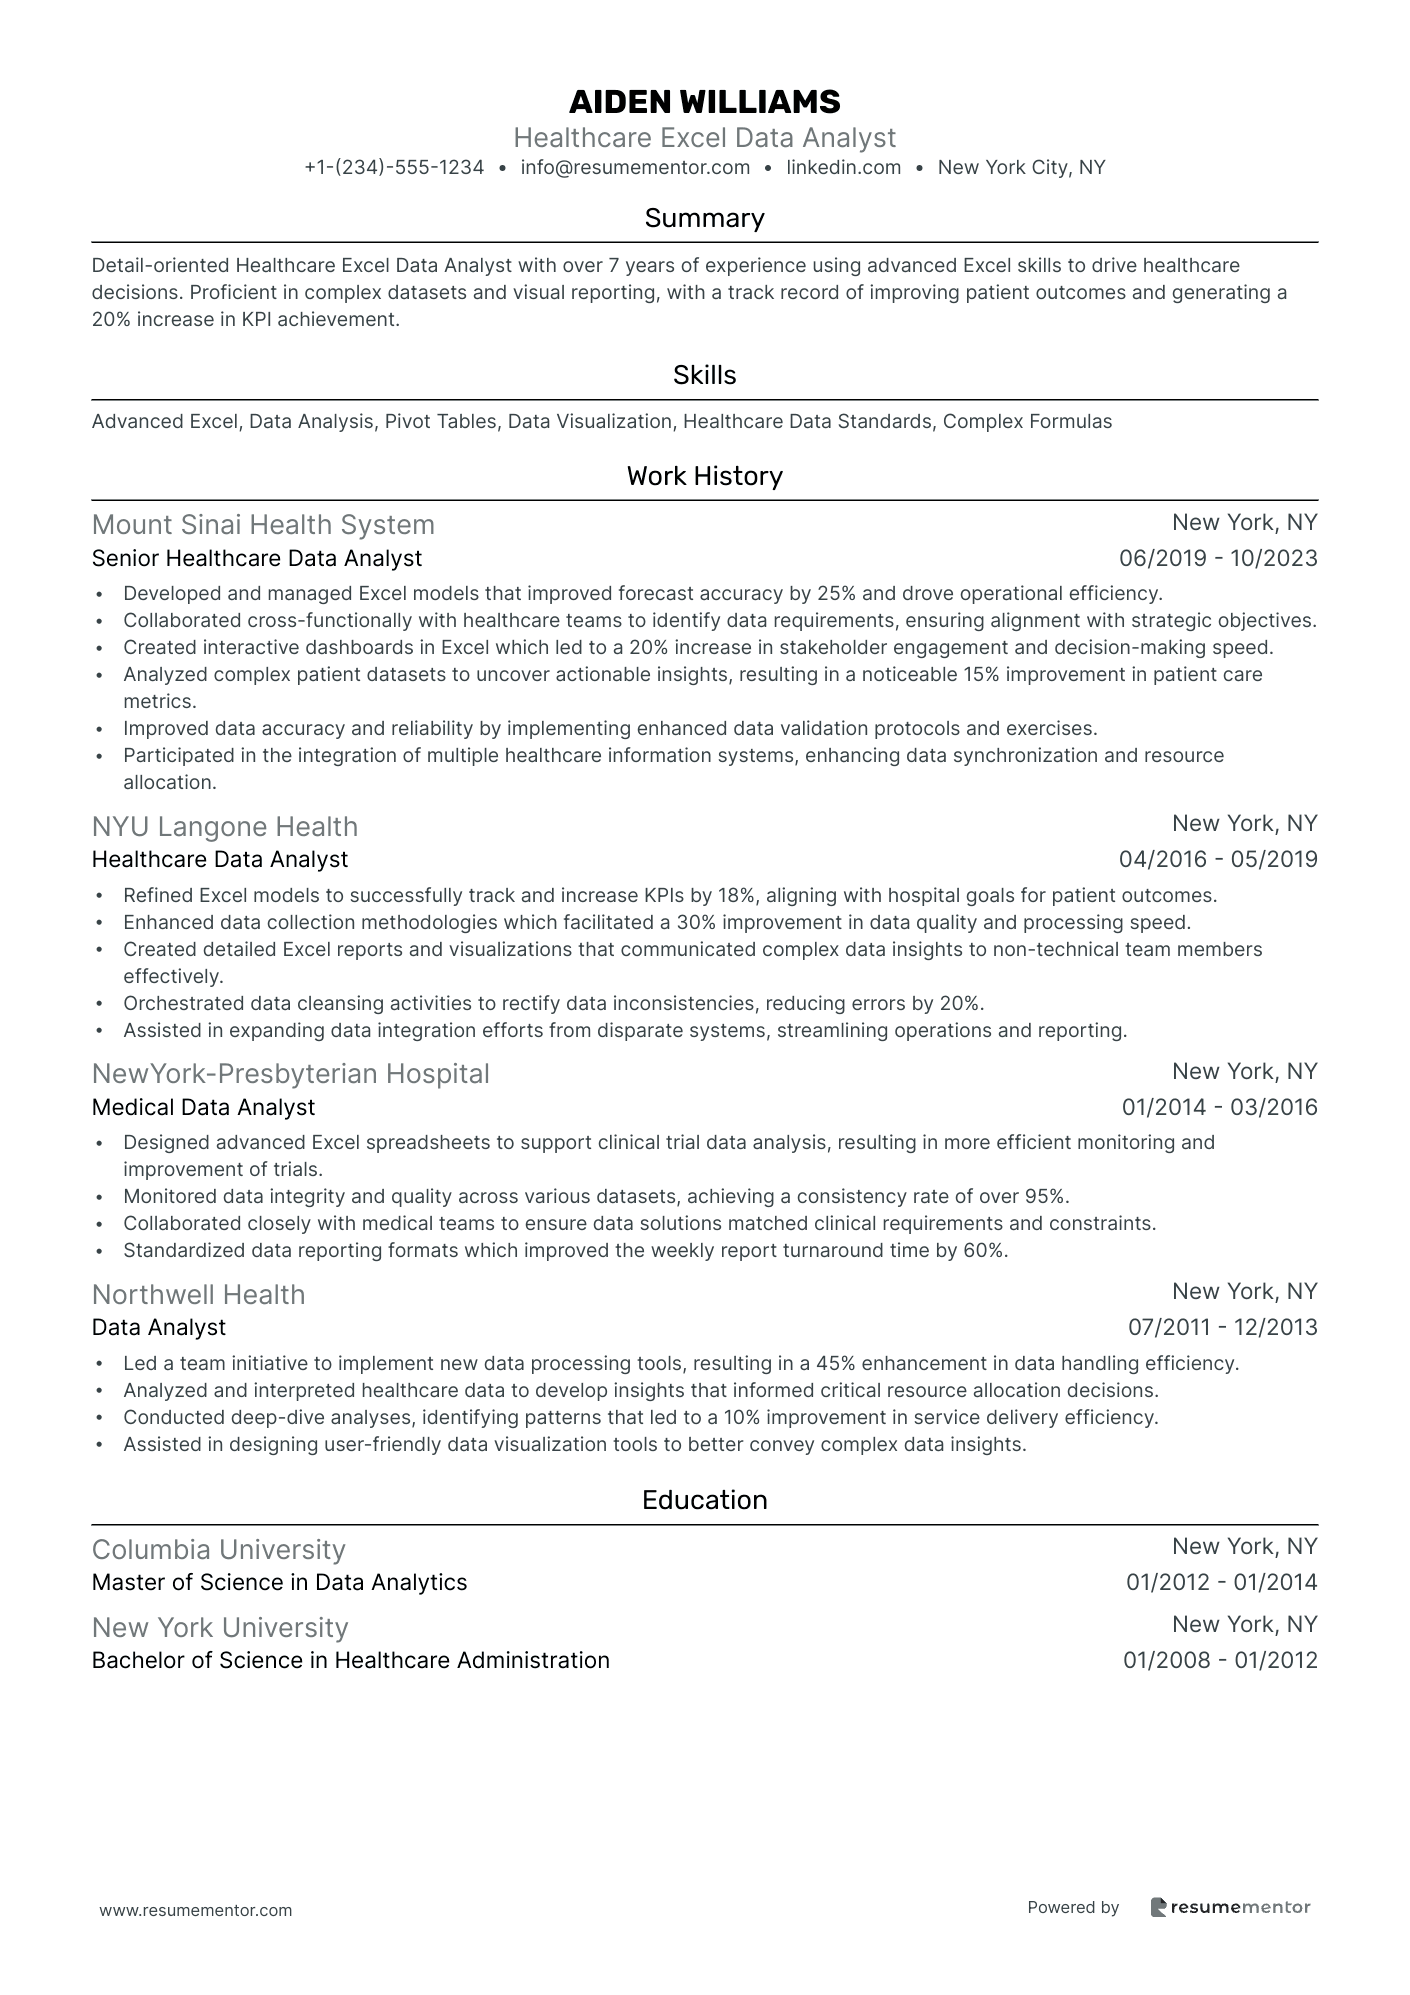
Healthcare Excel Data Analyst
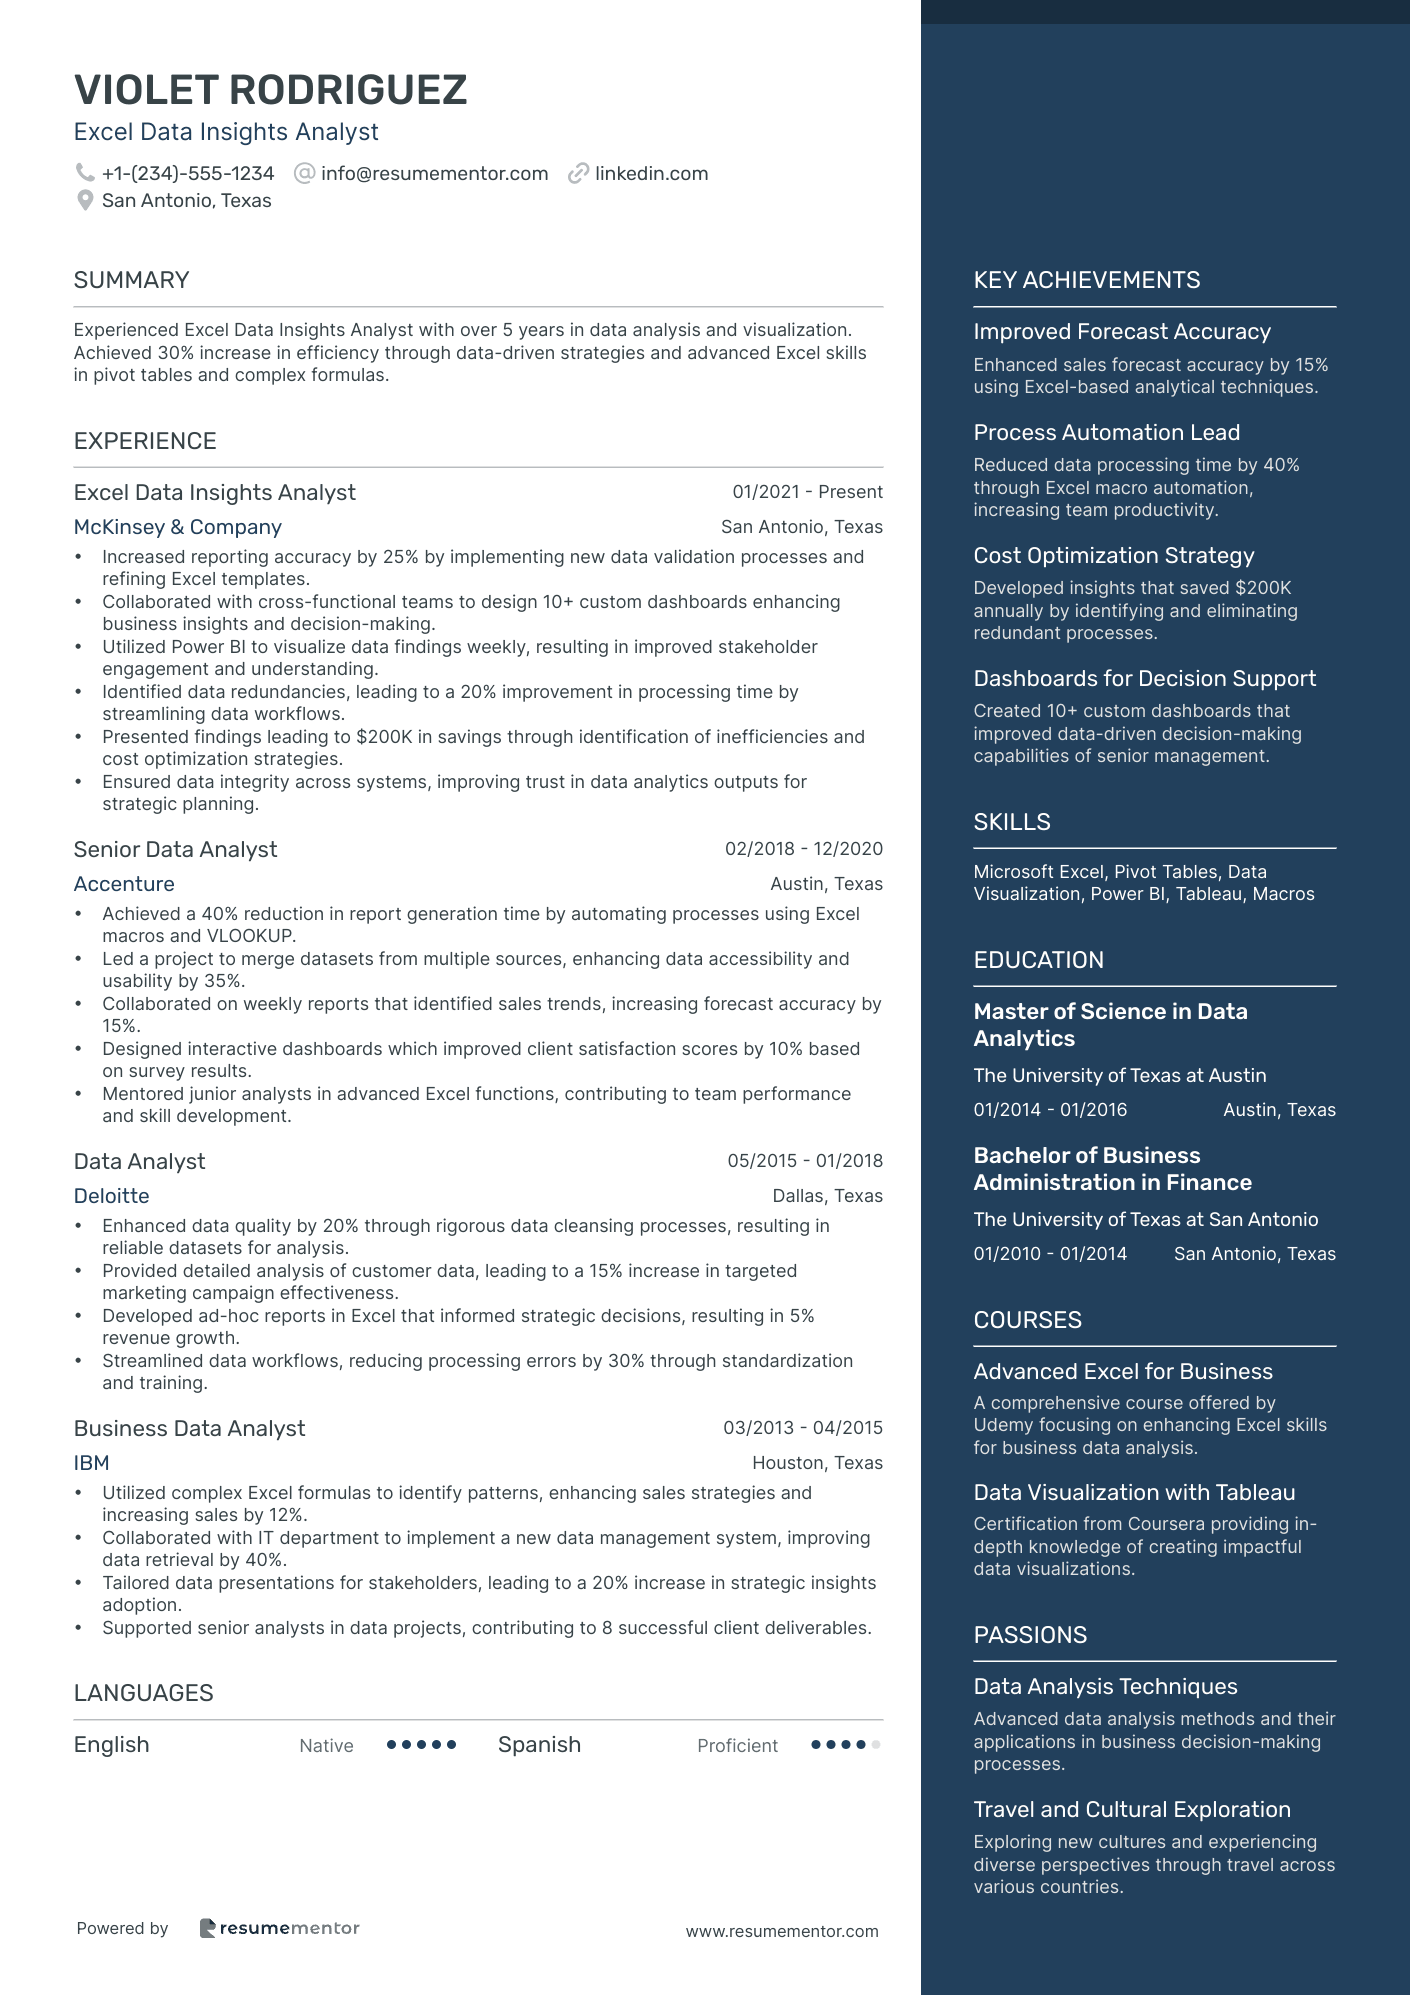
Excel Data Insights Analyst
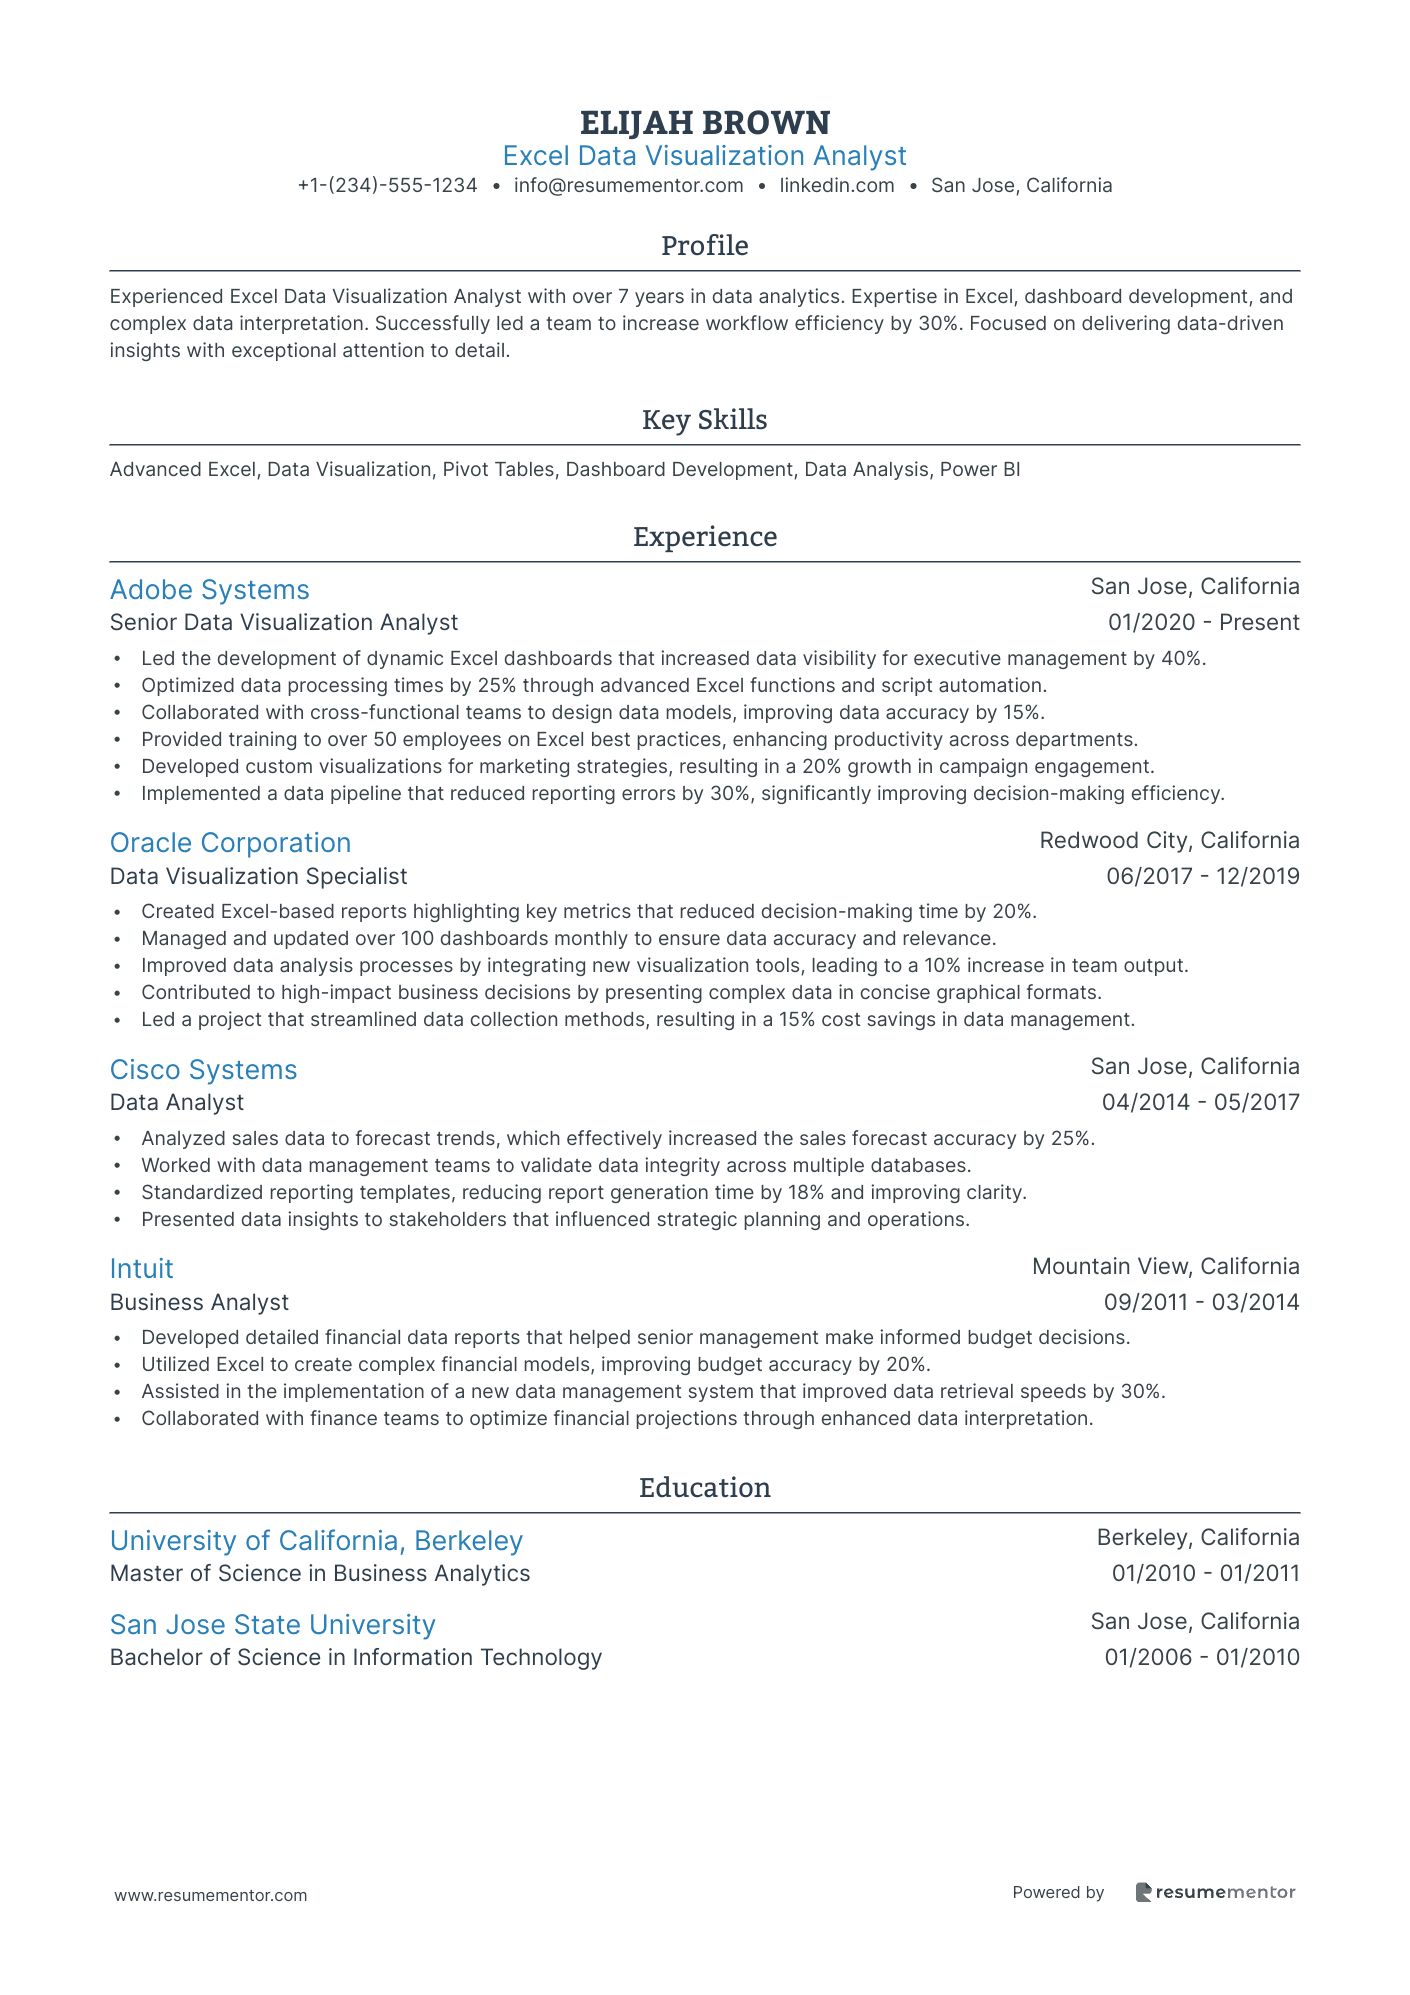
Excel Data Visualization Analyst
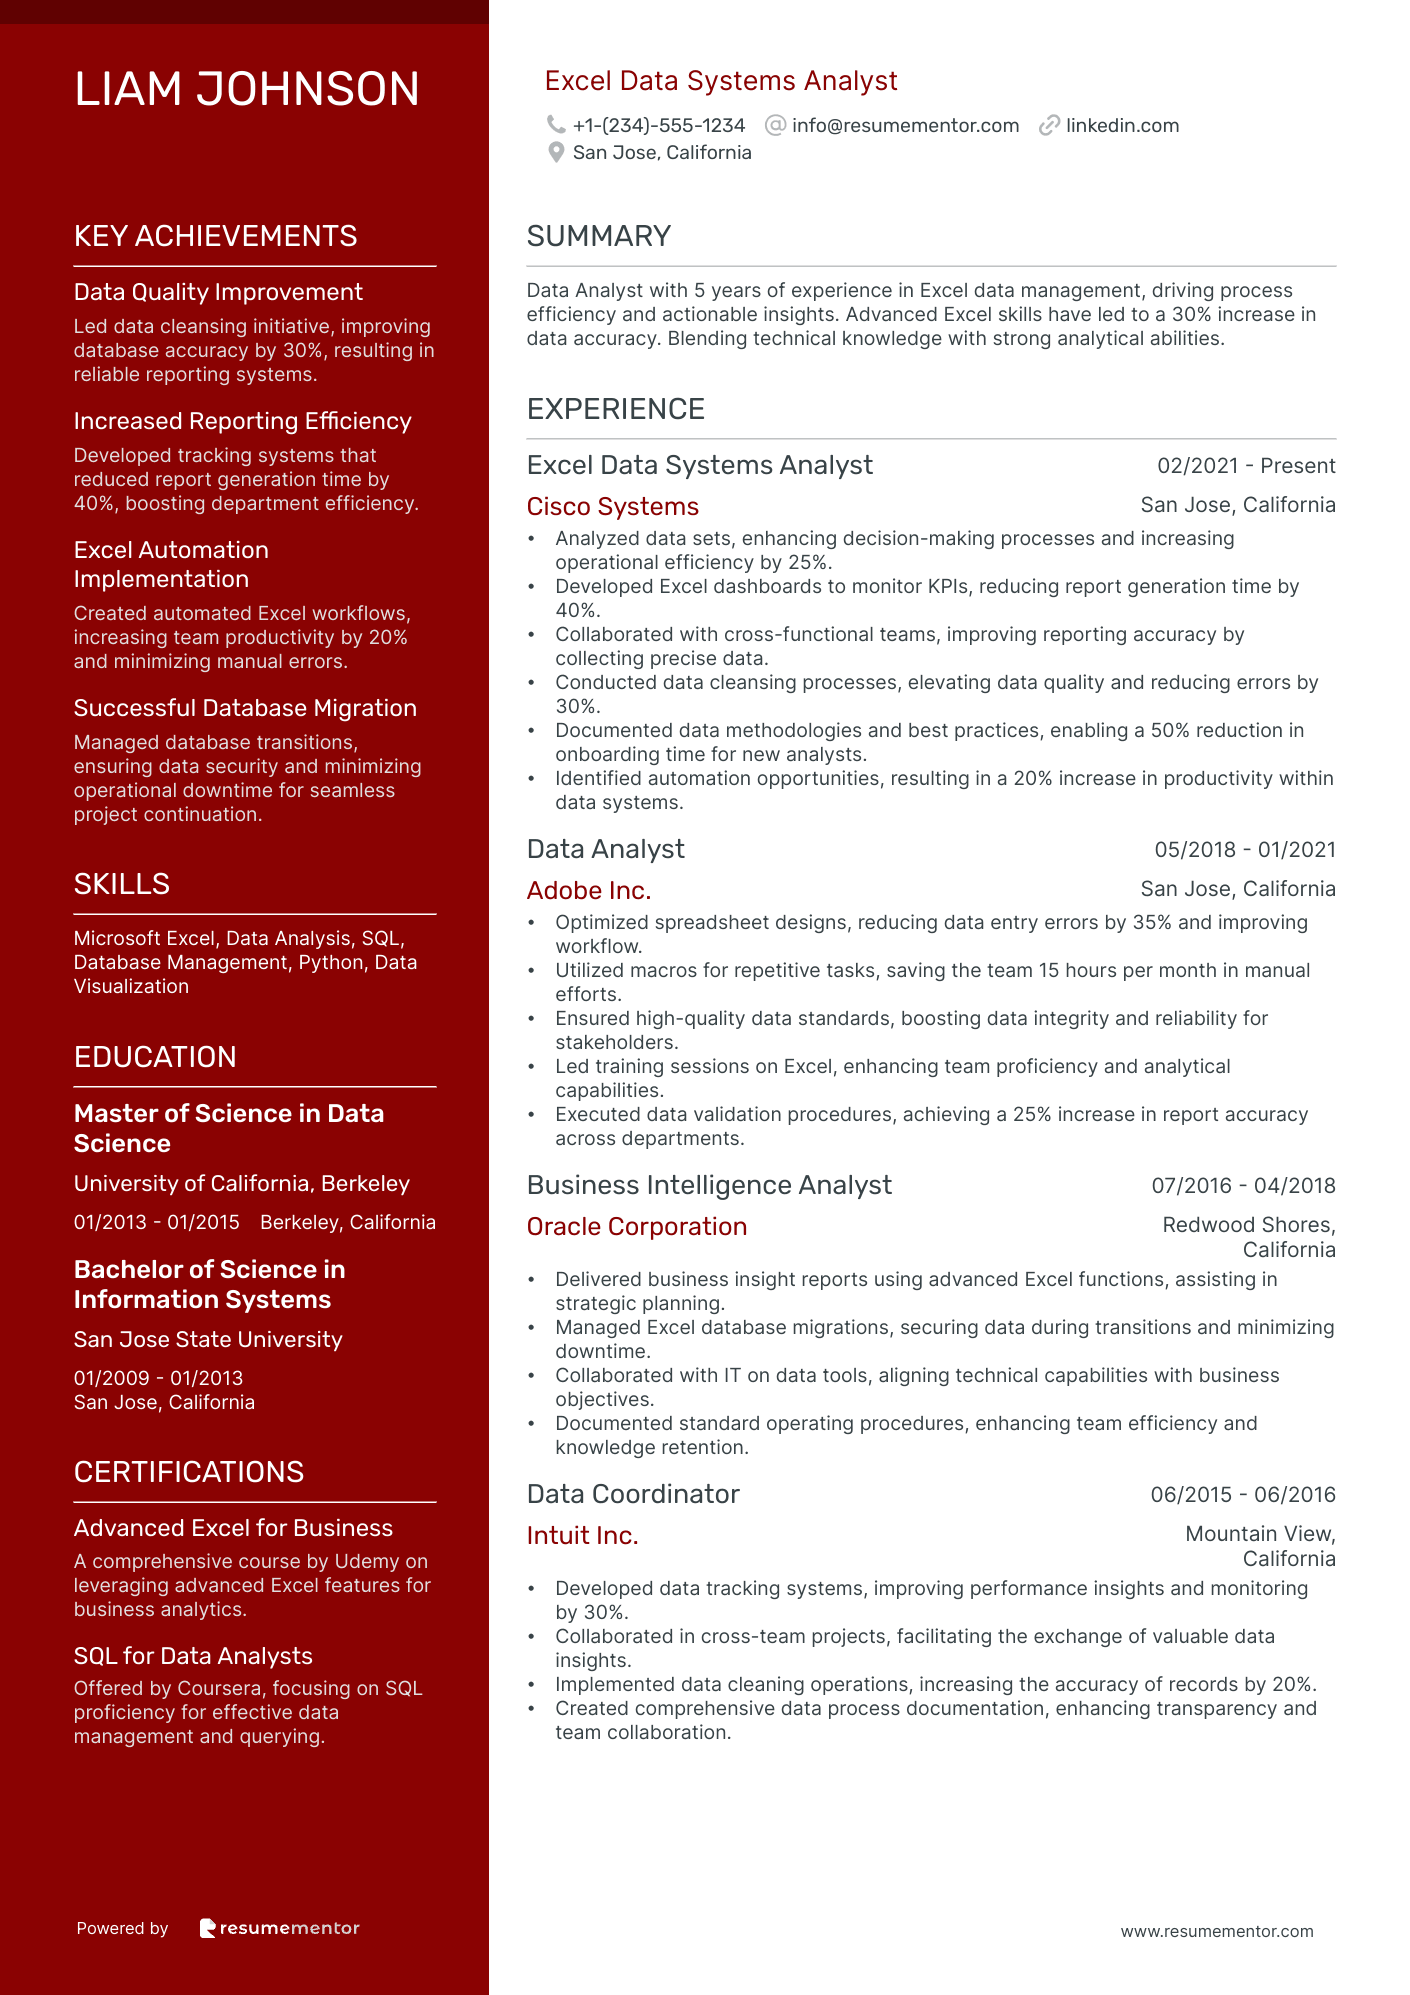
Excel Data Systems Analyst
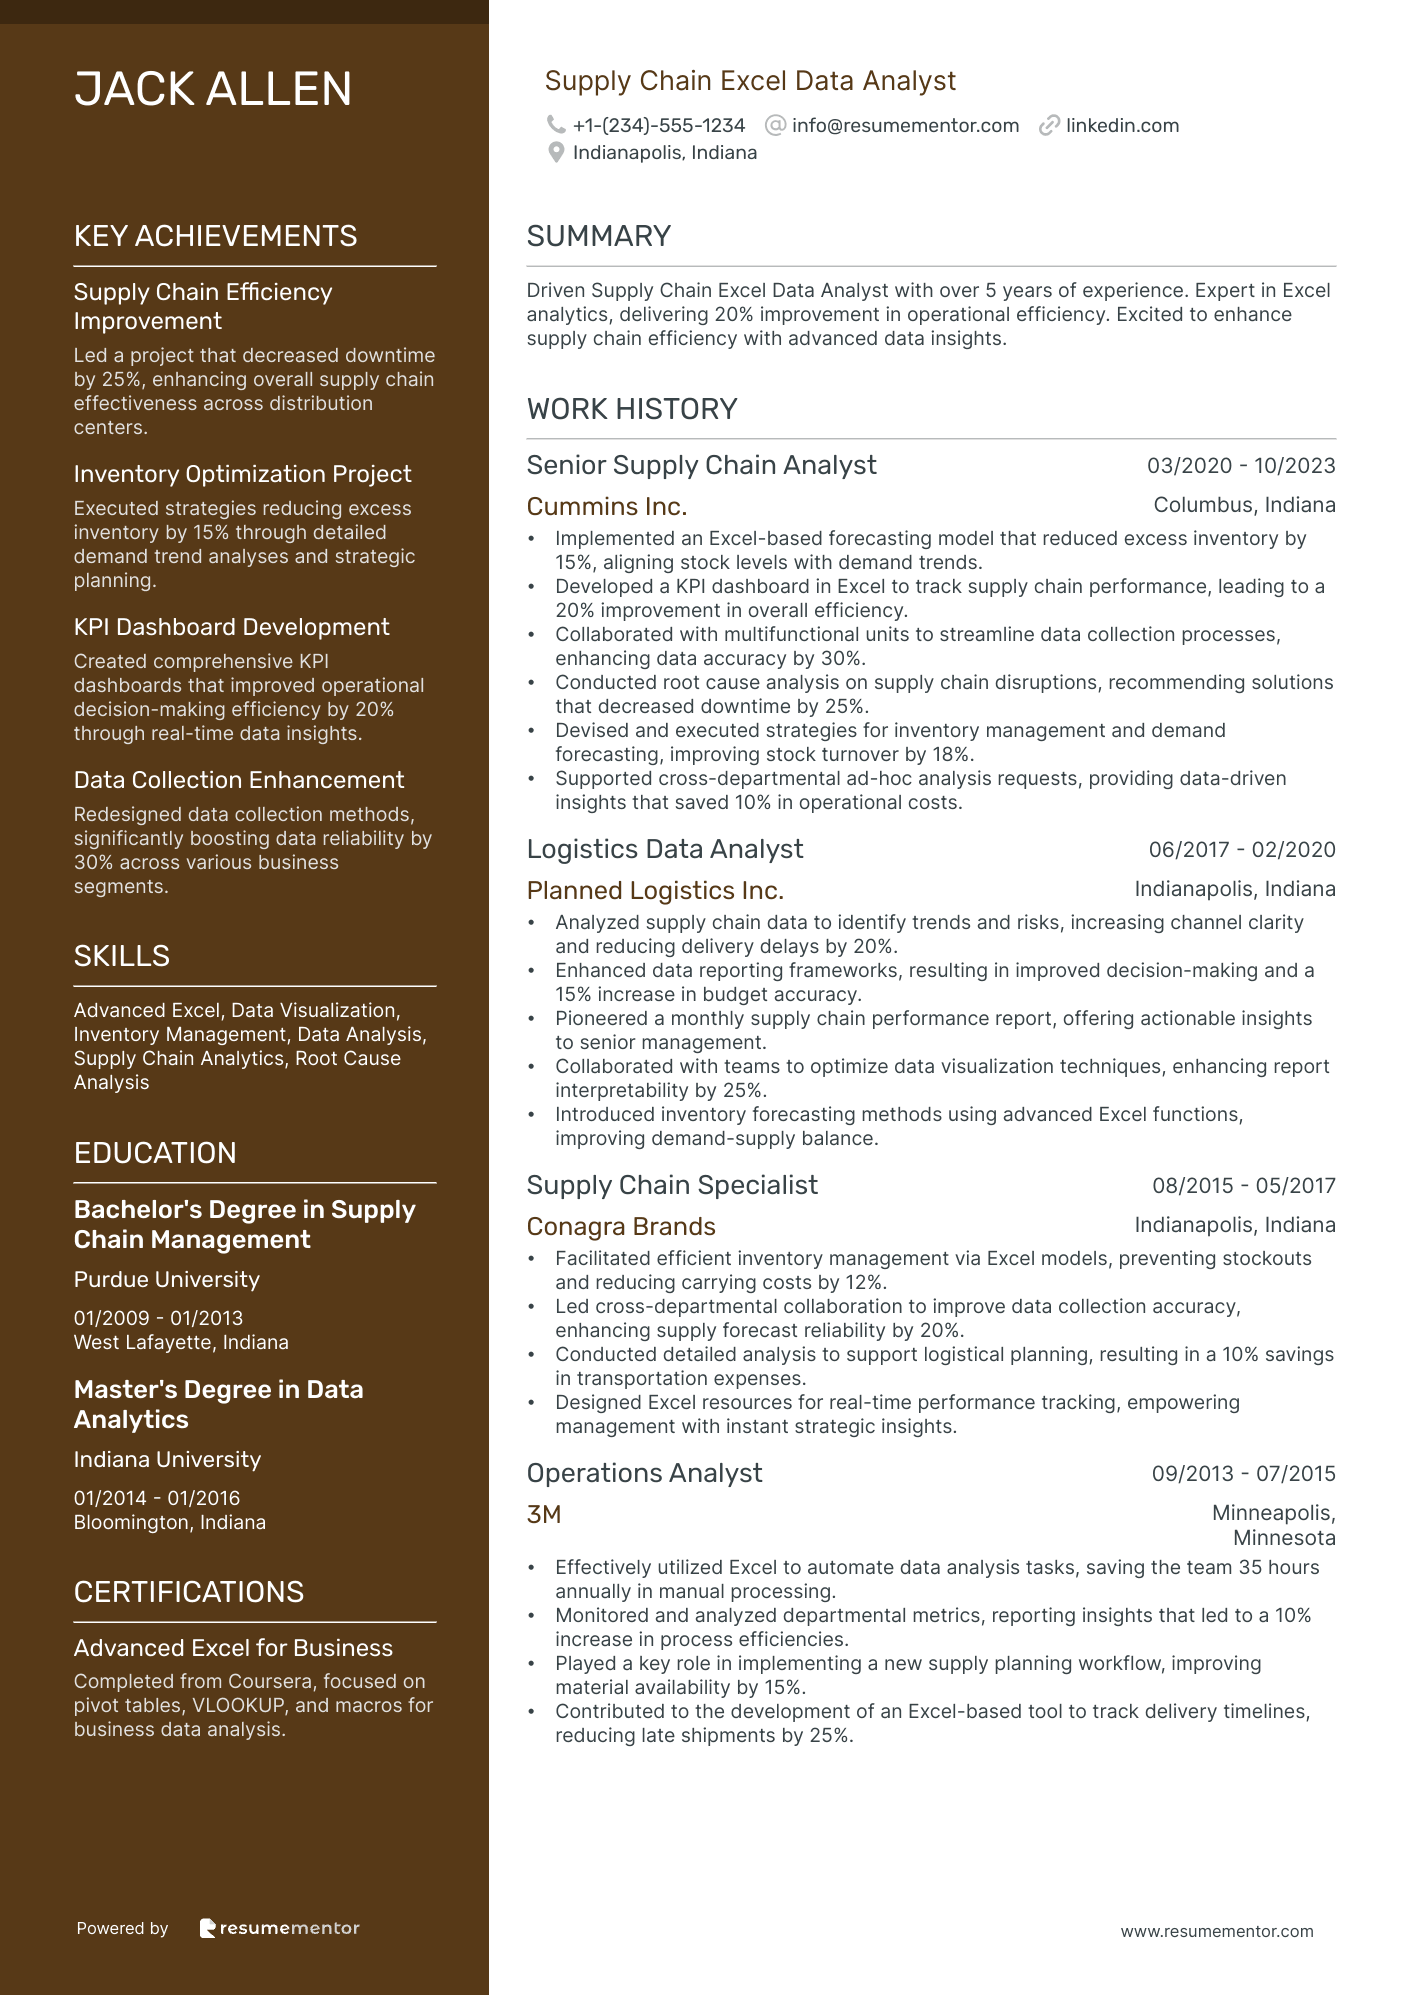
Supply Chain Excel Data Analyst
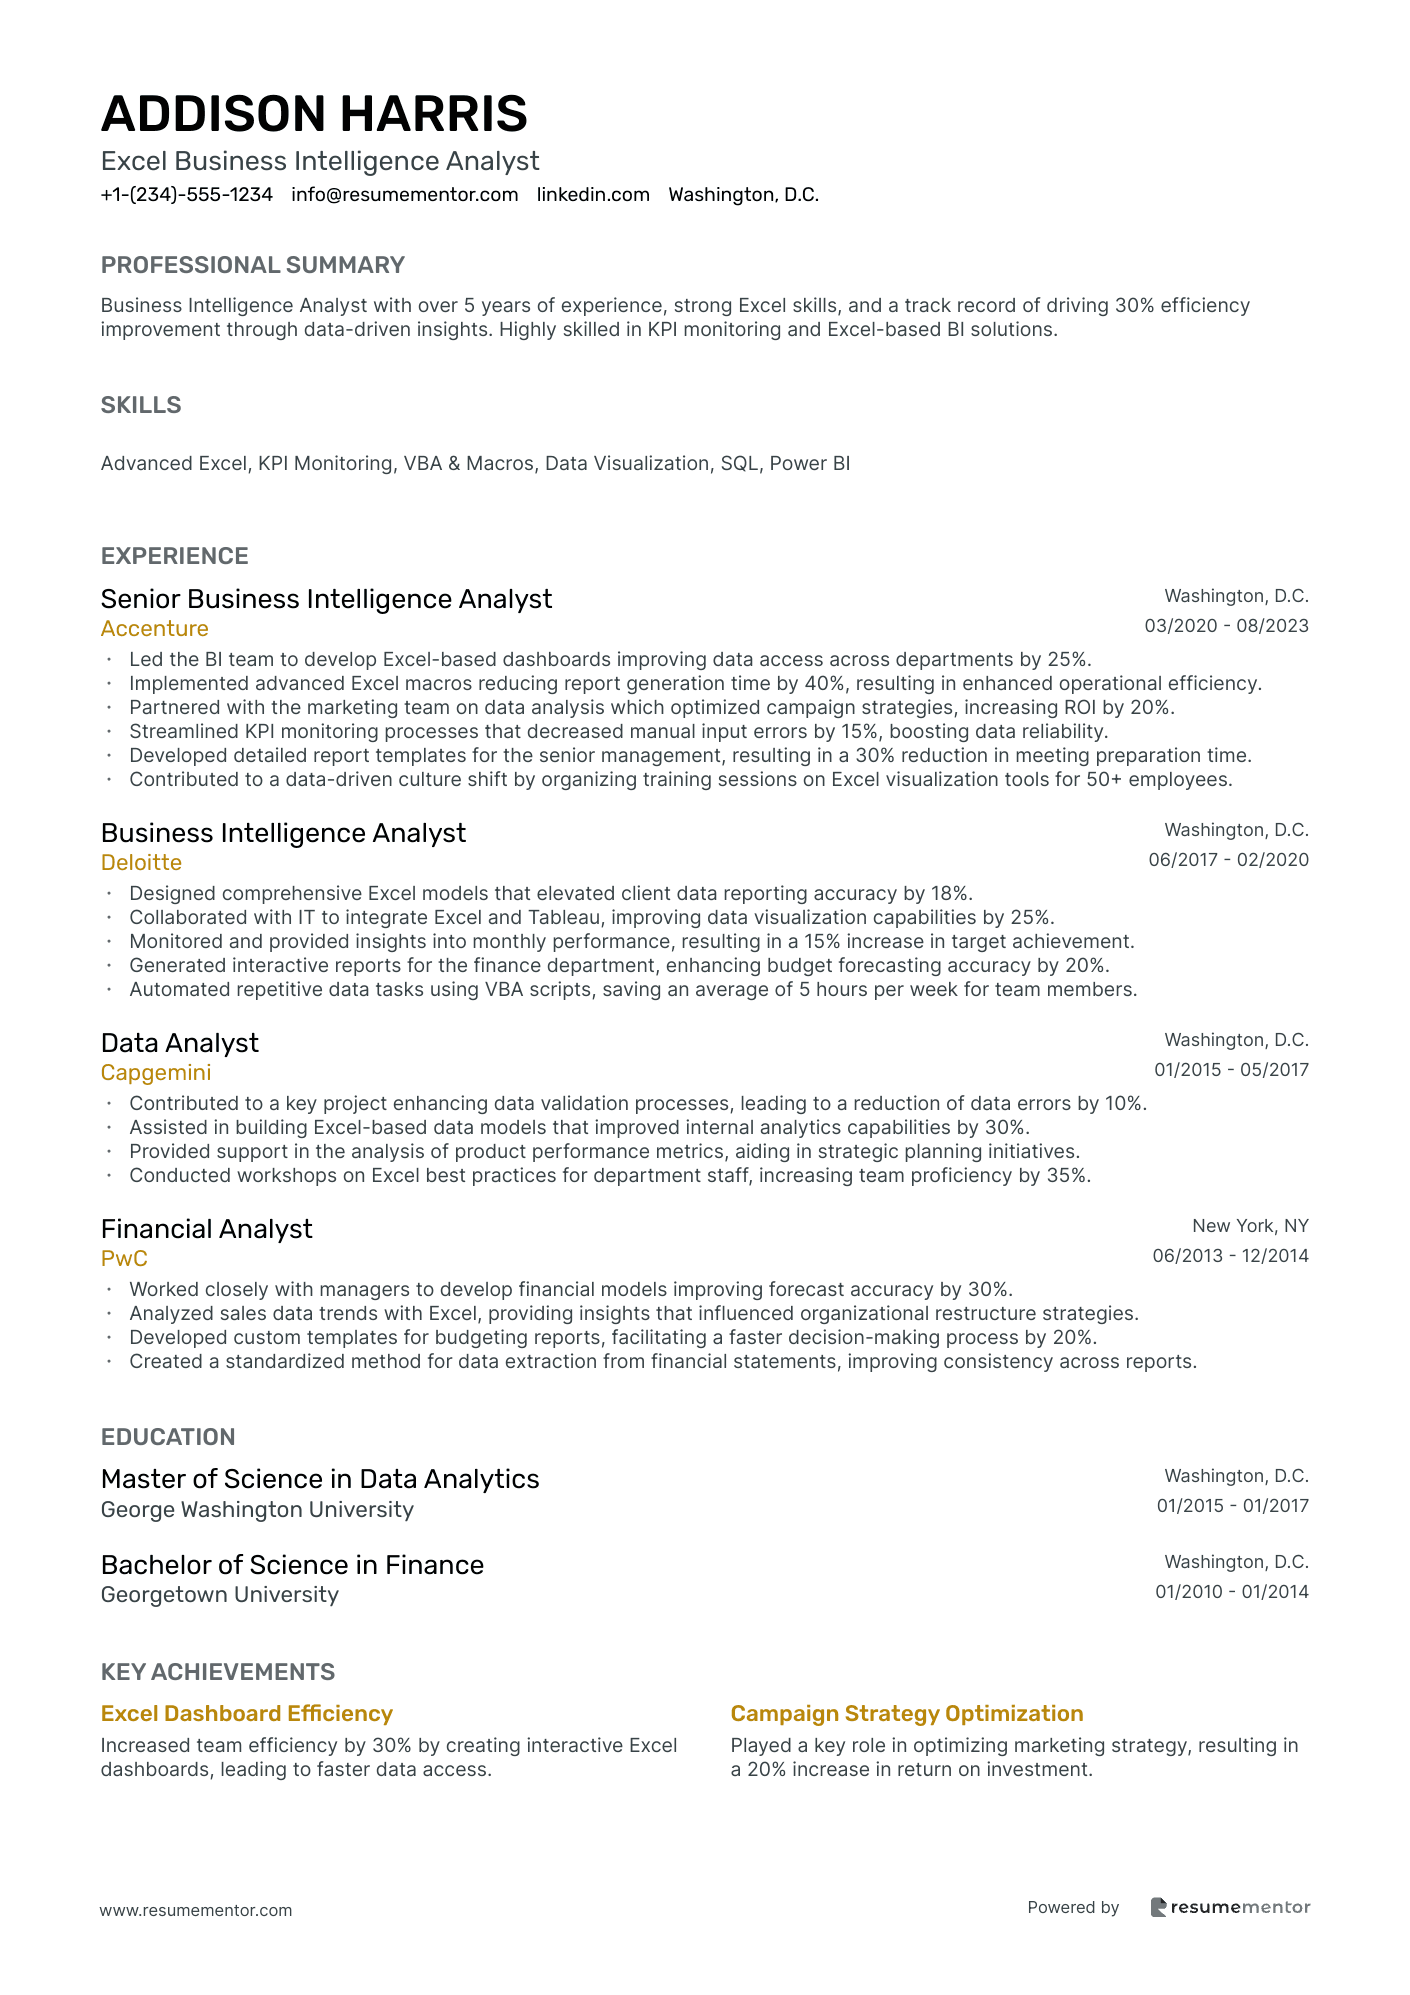
Excel Business Intelligence Analyst
Excel Data Analytics Consultant
Marketing Excel Data Analyst

Financial Excel Data Analyst resume sample
- •Developed comprehensive financial reports and dashboards leading to a reduction in operating costs by 15% over six months.
- •Collaborated with cross-functional teams to conduct variance analysis, improving budget accuracy by 25% year-over-year.
- •Implemented predictive financial models which elevated quarterly earnings forecasting precision by 18%.
- •Optimized financial databases by removing duplicate entries, streamlining data retrieval processes by 30%.
- •Presented complex financial insights to executive teams, aiding strategic planning and securing funding for three key projects.
- •Spearheaded special projects uncovering revenue growth opportunities, resulting in a $500,000 increase over two quarters.
- •Utilized advanced Excel functions to prepare detailed monthly financial reports, improving timeliness by 20%.
- •Led a project in developing financial forecasts which reduced variance from actuals by 12%.
- •Conducted market trend analysis, providing actionable recommendations that improved profit margins by 4%.
- •Enhanced financial models to support strategic growth, contributing to a 15% increase in investments.
- •Ensured data accuracy, enhancing the reliability of the financial database systems and reducing data discrepancies by 40%.
- •Built financial dashboards that increased data transparency, inspiring managerial decision changes that boosted production efficiency.
- •Provided in-depth variance analysis to evaluate budget performance, improving financial accuracy by 8%.
- •Initiated process improvements for financial reporting, resulting in a 10% decrease in reporting time.
- •Collaborated on financial modeling projects aimed at identifying cost savings, advancing strategic decisions.
- •Assisted in constructing financial forecasts and reports, enhancing forecast reliability and facilitating improved finance planning.
- •Monitored financial databases, leading to a decrease in data entry errors and improving the overall system's efficiency.
- •Prepared financial documentation to assist senior analysts in formulating strategic decisions with increased accuracy.
- •Participated in financial data analysis allowing for holistic view of operational processes and encouraging strategic improvements.
Excel Data Quality Analyst resume sample
- •Led a team in the data quality assessment project that improved data accuracy by 30% over a fiscal year.
- •Designed an automated Excel dataset analysis tool using macros, resulting in a 50% efficiency increase in data review processes.
- •Developed and documented standard operating procedures for data validation, ensuring compliance with data governance policies.
- •Collaborated across departments to implement data cleansing processes, enhancing data integrity and reducing error rates by 20%.
- •Conducted training sessions for 50 team members on advanced Excel functions and data quality standards.
- •Generated comprehensive reports utilizing pivot tables to identify and resolve data discrepancies in a timely manner.
- •Executed regular audits on datasets, achieving a 25% reduction in data inconsistencies over 12 months.
- •Championed a cross-departmental initiative to standardize data entry protocols, resulting in improved data reliability.
- •Utilized advanced Excel techniques such as VLOOKUP and INDEX/MATCH to streamline data validation processes.
- •Developed data visualization dashboards in Tableau, improving report clarity and decision-making efficiency for management.
- •Maintained and updated documentation on best practices in data quality assurance and compliance.
- •Analyzed large datasets and identified trends, providing insights that led to a 15% increase in operational efficiency.
- •Implemented data quality improvement strategies that decreased processing errors by 10%.
- •Supported the development of advanced Excel reporting tools, which enhanced data presentation capabilities.
- •Facilitated workshops focused on data management principles and data quality enhancement techniques.
- •Investigated and resolved data discrepancies in Excel datasets, improving overall data integrity by 5%.
- •Contributed to data governance initiatives that ensured compliance with internal data standards and external regulations.
- •Developed complex Excel models that streamlined data calculation processes, saving time and resources.
- •Collaborated with IT teams to enhance database management practices, supporting higher data accuracy levels.
Healthcare Excel Data Analyst resume sample
- •Developed and managed Excel models that improved forecast accuracy by 25% and drove operational efficiency.
- •Collaborated cross-functionally with healthcare teams to identify data requirements, ensuring alignment with strategic objectives.
- •Created interactive dashboards in Excel which led to a 20% increase in stakeholder engagement and decision-making speed.
- •Analyzed complex patient datasets to uncover actionable insights, resulting in a noticeable 15% improvement in patient care metrics.
- •Improved data accuracy and reliability by implementing enhanced data validation protocols and exercises.
- •Participated in the integration of multiple healthcare information systems, enhancing data synchronization and resource allocation.
- •Refined Excel models to successfully track and increase KPIs by 18%, aligning with hospital goals for patient outcomes.
- •Enhanced data collection methodologies which facilitated a 30% improvement in data quality and processing speed.
- •Created detailed Excel reports and visualizations that communicated complex data insights to non-technical team members effectively.
- •Orchestrated data cleansing activities to rectify data inconsistencies, reducing errors by 20%.
- •Assisted in expanding data integration efforts from disparate systems, streamlining operations and reporting.
- •Designed advanced Excel spreadsheets to support clinical trial data analysis, resulting in more efficient monitoring and improvement of trials.
- •Monitored data integrity and quality across various datasets, achieving a consistency rate of over 95%.
- •Collaborated closely with medical teams to ensure data solutions matched clinical requirements and constraints.
- •Standardized data reporting formats which improved the weekly report turnaround time by 60%.
- •Led a team initiative to implement new data processing tools, resulting in a 45% enhancement in data handling efficiency.
- •Analyzed and interpreted healthcare data to develop insights that informed critical resource allocation decisions.
- •Conducted deep-dive analyses, identifying patterns that led to a 10% improvement in service delivery efficiency.
- •Assisted in designing user-friendly data visualization tools to better convey complex data insights.
Excel Data Insights Analyst resume sample
- •Increased reporting accuracy by 25% by implementing new data validation processes and refining Excel templates.
- •Collaborated with cross-functional teams to design 10+ custom dashboards enhancing business insights and decision-making.
- •Utilized Power BI to visualize data findings weekly, resulting in improved stakeholder engagement and understanding.
- •Identified data redundancies, leading to a 20% improvement in processing time by streamlining data workflows.
- •Presented findings leading to $200K in savings through identification of inefficiencies and cost optimization strategies.
- •Ensured data integrity across systems, improving trust in data analytics outputs for strategic planning.
- •Achieved a 40% reduction in report generation time by automating processes using Excel macros and VLOOKUP.
- •Led a project to merge datasets from multiple sources, enhancing data accessibility and usability by 35%.
- •Collaborated on weekly reports that identified sales trends, increasing forecast accuracy by 15%.
- •Designed interactive dashboards which improved client satisfaction scores by 10% based on survey results.
- •Mentored junior analysts in advanced Excel functions, contributing to team performance and skill development.
- •Enhanced data quality by 20% through rigorous data cleansing processes, resulting in reliable datasets for analysis.
- •Provided detailed analysis of customer data, leading to a 15% increase in targeted marketing campaign effectiveness.
- •Developed ad-hoc reports in Excel that informed strategic decisions, resulting in 5% revenue growth.
- •Streamlined data workflows, reducing processing errors by 30% through standardization and training.
- •Utilized complex Excel formulas to identify patterns, enhancing sales strategies and increasing sales by 12%.
- •Collaborated with IT department to implement a new data management system, improving data retrieval by 40%.
- •Tailored data presentations for stakeholders, leading to a 20% increase in strategic insights adoption.
- •Supported senior analysts in data projects, contributing to 8 successful client deliverables.
Excel Data Visualization Analyst resume sample
- •Led the development of dynamic Excel dashboards that increased data visibility for executive management by 40%.
- •Optimized data processing times by 25% through advanced Excel functions and script automation.
- •Collaborated with cross-functional teams to design data models, improving data accuracy by 15%.
- •Provided training to over 50 employees on Excel best practices, enhancing productivity across departments.
- •Developed custom visualizations for marketing strategies, resulting in a 20% growth in campaign engagement.
- •Implemented a data pipeline that reduced reporting errors by 30%, significantly improving decision-making efficiency.
- •Created Excel-based reports highlighting key metrics that reduced decision-making time by 20%.
- •Managed and updated over 100 dashboards monthly to ensure data accuracy and relevance.
- •Improved data analysis processes by integrating new visualization tools, leading to a 10% increase in team output.
- •Contributed to high-impact business decisions by presenting complex data in concise graphical formats.
- •Led a project that streamlined data collection methods, resulting in a 15% cost savings in data management.
- •Analyzed sales data to forecast trends, which effectively increased the sales forecast accuracy by 25%.
- •Worked with data management teams to validate data integrity across multiple databases.
- •Standardized reporting templates, reducing report generation time by 18% and improving clarity.
- •Presented data insights to stakeholders that influenced strategic planning and operations.
- •Developed detailed financial data reports that helped senior management make informed budget decisions.
- •Utilized Excel to create complex financial models, improving budget accuracy by 20%.
- •Assisted in the implementation of a new data management system that improved data retrieval speeds by 30%.
- •Collaborated with finance teams to optimize financial projections through enhanced data interpretation.
Excel Data Systems Analyst resume sample
- •Analyzed data sets, enhancing decision-making processes and increasing operational efficiency by 25%.
- •Developed Excel dashboards to monitor KPIs, reducing report generation time by 40%.
- •Collaborated with cross-functional teams, improving reporting accuracy by collecting precise data.
- •Conducted data cleansing processes, elevating data quality and reducing errors by 30%.
- •Documented data methodologies and best practices, enabling a 50% reduction in onboarding time for new analysts.
- •Identified automation opportunities, resulting in a 20% increase in productivity within data systems.
- •Optimized spreadsheet designs, reducing data entry errors by 35% and improving workflow.
- •Utilized macros for repetitive tasks, saving the team 15 hours per month in manual efforts.
- •Ensured high-quality data standards, boosting data integrity and reliability for stakeholders.
- •Led training sessions on Excel, enhancing team proficiency and analytical capabilities.
- •Executed data validation procedures, achieving a 25% increase in report accuracy across departments.
- •Delivered business insight reports using advanced Excel functions, assisting in strategic planning.
- •Managed Excel database migrations, securing data during transitions and minimizing downtime.
- •Collaborated with IT on data tools, aligning technical capabilities with business objectives.
- •Documented standard operating procedures, enhancing team efficiency and knowledge retention.
- •Developed data tracking systems, improving performance insights and monitoring by 30%.
- •Collaborated in cross-team projects, facilitating the exchange of valuable data insights.
- •Implemented data cleaning operations, increasing the accuracy of records by 20%.
- •Created comprehensive data process documentation, enhancing transparency and team collaboration.
Supply Chain Excel Data Analyst resume sample
- •Implemented an Excel-based forecasting model that reduced excess inventory by 15%, aligning stock levels with demand trends.
- •Developed a KPI dashboard in Excel to track supply chain performance, leading to a 20% improvement in overall efficiency.
- •Collaborated with multifunctional units to streamline data collection processes, enhancing data accuracy by 30%.
- •Conducted root cause analysis on supply chain disruptions, recommending solutions that decreased downtime by 25%.
- •Devised and executed strategies for inventory management and demand forecasting, improving stock turnover by 18%.
- •Supported cross-departmental ad-hoc analysis requests, providing data-driven insights that saved 10% in operational costs.
- •Analyzed supply chain data to identify trends and risks, increasing channel clarity and reducing delivery delays by 20%.
- •Enhanced data reporting frameworks, resulting in improved decision-making and a 15% increase in budget accuracy.
- •Pioneered a monthly supply chain performance report, offering actionable insights to senior management.
- •Collaborated with teams to optimize data visualization techniques, enhancing report interpretability by 25%.
- •Introduced inventory forecasting methods using advanced Excel functions, improving demand-supply balance.
- •Facilitated efficient inventory management via Excel models, preventing stockouts and reducing carrying costs by 12%.
- •Led cross-departmental collaboration to improve data collection accuracy, enhancing supply forecast reliability by 20%.
- •Conducted detailed analysis to support logistical planning, resulting in a 10% savings in transportation expenses.
- •Designed Excel resources for real-time performance tracking, empowering management with instant strategic insights.
- •Effectively utilized Excel to automate data analysis tasks, saving the team 35 hours annually in manual processing.
- •Monitored and analyzed departmental metrics, reporting insights that led to a 10% increase in process efficiencies.
- •Played a key role in implementing a new supply planning workflow, improving material availability by 15%.
- •Contributed to the development of an Excel-based tool to track delivery timelines, reducing late shipments by 25%.
Excel Business Intelligence Analyst resume sample
- •Led the BI team to develop Excel-based dashboards improving data access across departments by 25%.
- •Implemented advanced Excel macros reducing report generation time by 40%, resulting in enhanced operational efficiency.
- •Partnered with the marketing team on data analysis which optimized campaign strategies, increasing ROI by 20%.
- •Streamlined KPI monitoring processes that decreased manual input errors by 15%, boosting data reliability.
- •Developed detailed report templates for the senior management, resulting in a 30% reduction in meeting preparation time.
- •Contributed to a data-driven culture shift by organizing training sessions on Excel visualization tools for 50+ employees.
- •Designed comprehensive Excel models that elevated client data reporting accuracy by 18%.
- •Collaborated with IT to integrate Excel and Tableau, improving data visualization capabilities by 25%.
- •Monitored and provided insights into monthly performance, resulting in a 15% increase in target achievement.
- •Generated interactive reports for the finance department, enhancing budget forecasting accuracy by 20%.
- •Automated repetitive data tasks using VBA scripts, saving an average of 5 hours per week for team members.
- •Contributed to a key project enhancing data validation processes, leading to a reduction of data errors by 10%.
- •Assisted in building Excel-based data models that improved internal analytics capabilities by 30%.
- •Provided support in the analysis of product performance metrics, aiding in strategic planning initiatives.
- •Conducted workshops on Excel best practices for department staff, increasing team proficiency by 35%.
- •Worked closely with managers to develop financial models improving forecast accuracy by 30%.
- •Analyzed sales data trends with Excel, providing insights that influenced organizational restructure strategies.
- •Developed custom templates for budgeting reports, facilitating a faster decision-making process by 20%.
- •Created a standardized method for data extraction from financial statements, improving consistency across reports.
Excel Data Analytics Consultant resume sample
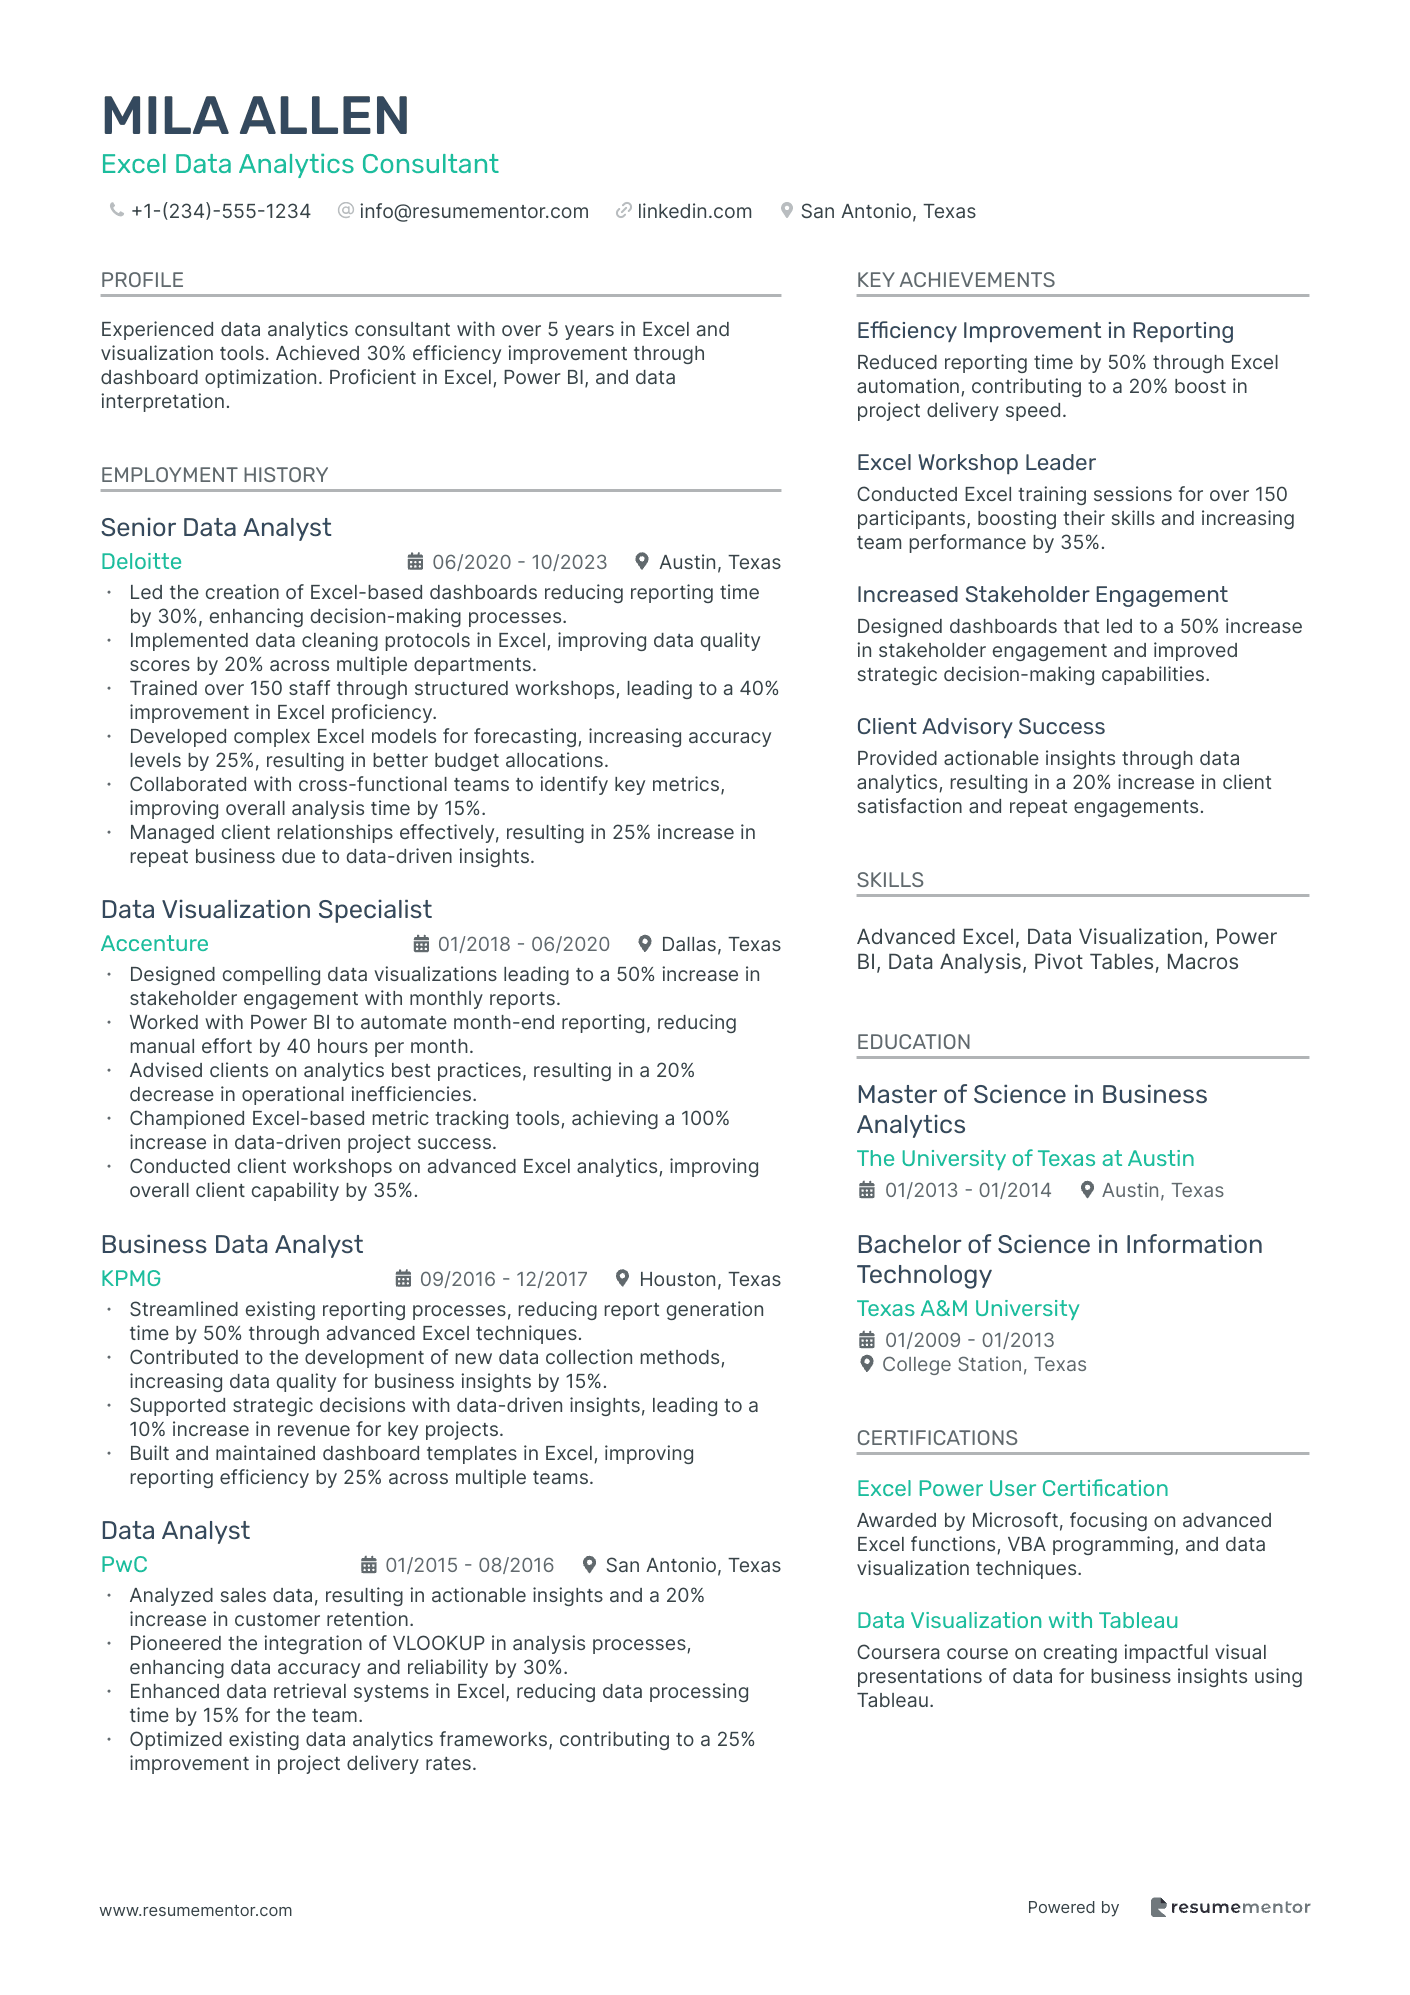
- •Led the creation of Excel-based dashboards reducing reporting time by 30%, enhancing decision-making processes.
- •Implemented data cleaning protocols in Excel, improving data quality scores by 20% across multiple departments.
- •Trained over 150 staff through structured workshops, leading to a 40% improvement in Excel proficiency.
- •Developed complex Excel models for forecasting, increasing accuracy levels by 25%, resulting in better budget allocations.
- •Collaborated with cross-functional teams to identify key metrics, improving overall analysis time by 15%.
- •Managed client relationships effectively, resulting in 25% increase in repeat business due to data-driven insights.
- •Designed compelling data visualizations leading to a 50% increase in stakeholder engagement with monthly reports.
- •Worked with Power BI to automate month-end reporting, reducing manual effort by 40 hours per month.
- •Advised clients on analytics best practices, resulting in a 20% decrease in operational inefficiencies.
- •Championed Excel-based metric tracking tools, achieving a 100% increase in data-driven project success.
- •Conducted client workshops on advanced Excel analytics, improving overall client capability by 35%.
- •Streamlined existing reporting processes, reducing report generation time by 50% through advanced Excel techniques.
- •Contributed to the development of new data collection methods, increasing data quality for business insights by 15%.
- •Supported strategic decisions with data-driven insights, leading to a 10% increase in revenue for key projects.
- •Built and maintained dashboard templates in Excel, improving reporting efficiency by 25% across multiple teams.
- •Analyzed sales data, resulting in actionable insights and a 20% increase in customer retention.
- •Pioneered the integration of VLOOKUP in analysis processes, enhancing data accuracy and reliability by 30%.
- •Enhanced data retrieval systems in Excel, reducing data processing time by 15% for the team.
- •Optimized existing data analytics frameworks, contributing to a 25% improvement in project delivery rates.
Marketing Excel Data Analyst resume sample
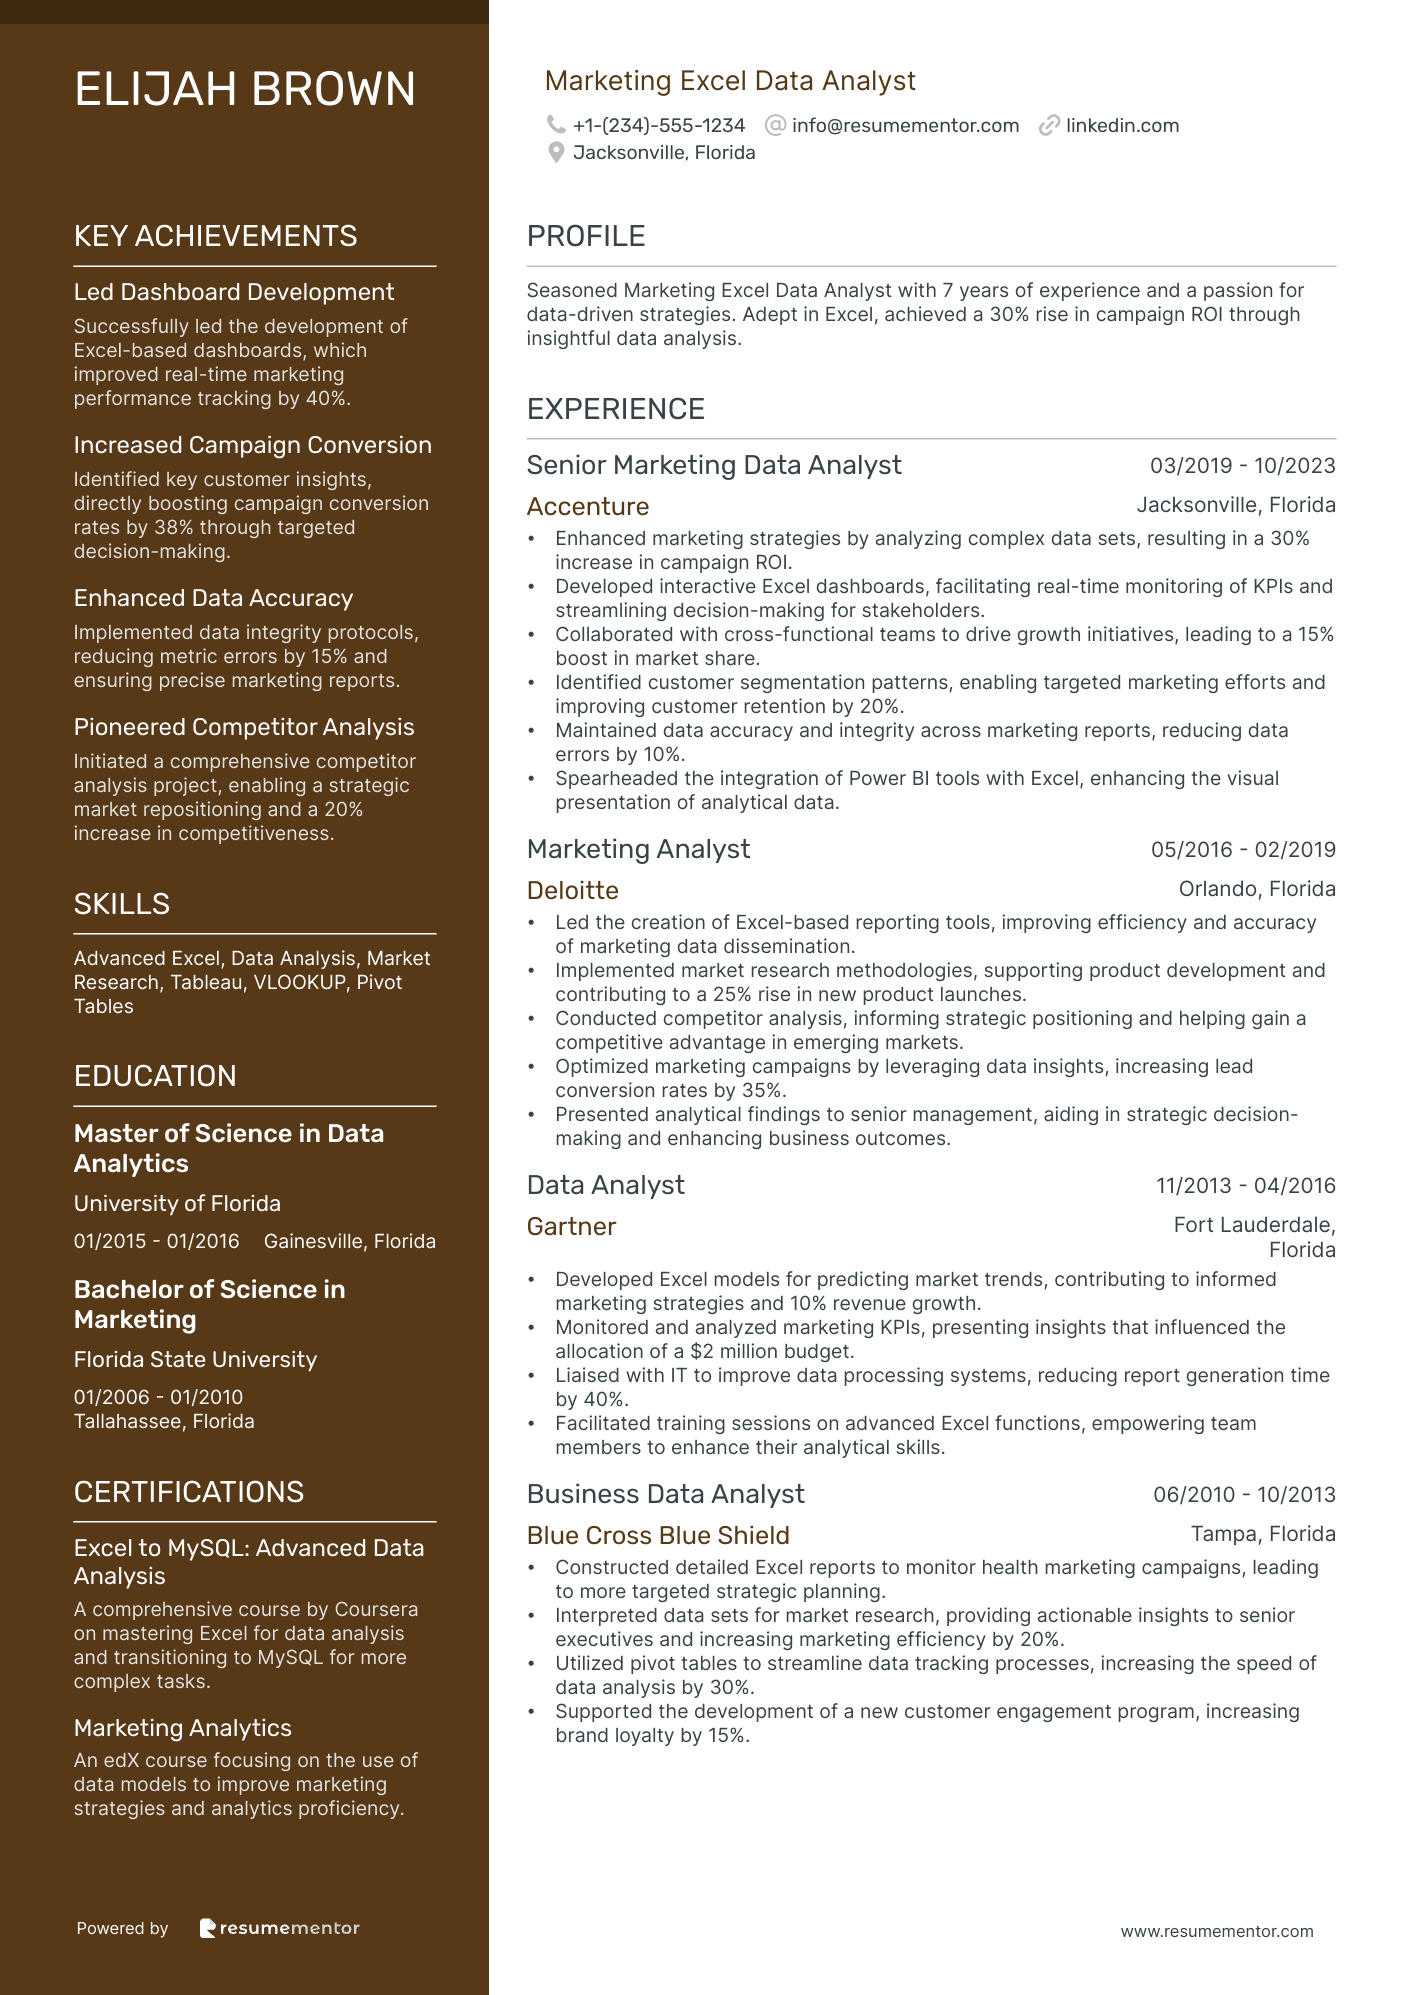
- •Enhanced marketing strategies by analyzing complex data sets, resulting in a 30% increase in campaign ROI.
- •Developed interactive Excel dashboards, facilitating real-time monitoring of KPIs and streamlining decision-making for stakeholders.
- •Collaborated with cross-functional teams to drive growth initiatives, leading to a 15% boost in market share.
- •Identified customer segmentation patterns, enabling targeted marketing efforts and improving customer retention by 20%.
- •Maintained data accuracy and integrity across marketing reports, reducing data errors by 10%.
- •Spearheaded the integration of Power BI tools with Excel, enhancing the visual presentation of analytical data.
- •Led the creation of Excel-based reporting tools, improving efficiency and accuracy of marketing data dissemination.
- •Implemented market research methodologies, supporting product development and contributing to a 25% rise in new product launches.
- •Conducted competitor analysis, informing strategic positioning and helping gain a competitive advantage in emerging markets.
- •Optimized marketing campaigns by leveraging data insights, increasing lead conversion rates by 35%.
- •Presented analytical findings to senior management, aiding in strategic decision-making and enhancing business outcomes.
- •Developed Excel models for predicting market trends, contributing to informed marketing strategies and 10% revenue growth.
- •Monitored and analyzed marketing KPIs, presenting insights that influenced the allocation of a $2 million budget.
- •Liaised with IT to improve data processing systems, reducing report generation time by 40%.
- •Facilitated training sessions on advanced Excel functions, empowering team members to enhance their analytical skills.
- •Constructed detailed Excel reports to monitor health marketing campaigns, leading to more targeted strategic planning.
- •Interpreted data sets for market research, providing actionable insights to senior executives and increasing marketing efficiency by 20%.
- •Utilized pivot tables to streamline data tracking processes, increasing the speed of data analysis by 30%.
- •Supported the development of a new customer engagement program, increasing brand loyalty by 15%.
As an Excel data analyst, you dive deep to uncover insights hidden in rows and columns, yet translating these skills into a compelling resume can be challenging. It's essential to weave your analytical expertise into a narrative that resonates with employers, much like how you transform data into compelling insights. While crafting visualizations and actionable insights is your forte, presenting these on paper requires a strategic approach.
Using a structured resume template can significantly streamline this process. A well-designed template ensures your resume is organized and visually appealing, mirroring the clarity and precision you apply to data analysis. This foundation helps to spotlight your data-driven achievements in a coherent and impactful way. In the competitive job market, a well-crafted resume not only highlights your skills but also distinguishes you by demonstrating the unique value you offer.
As you embark on this task, focus on aligning your resume content with what employers seek, just as you align data patterns to uncover insights. With the right approach, your resume can become a powerful tool that opens the door to exciting new opportunities.
Key Takeaways
- Crafting a structured resume for an Excel data analyst is crucial, as it helps in presenting analytical skills and achievements effectively to potential employers.
- Key sections to include are contact information, a professional summary, skills, work experience, education, and if applicable, a projects or portfolio section.
- Choosing the right resume format, such as reverse-chronological, and ensuring formatting elements like fonts and margins enhance readability is essential for a professional presentation.
- Work experience should be detailed with quantifiable achievements to showcase the tangible impact you’ve made in previous roles, using specific examples to highlight your expertise.
- Including a dedicated skills section with both hard and soft skills, and listing any relevant certifications or education, further solidifies your qualifications as an Excel data analyst.
What to focus on when writing your excel data analyst resume
Your Excel data analyst resume should clearly convey your ability to manage data and extract valuable insights using Excel. Recruiters need to understand not just your technical expertise, but also how you apply those skills to solve problems and visualize data effectively.
How to structure your excel data analyst resume
- Contact Information: Start with your full name, phone number, email, and LinkedIn profile. Ensure this section is clearly visible at the top of your resume. Providing a professional LinkedIn profile can give recruiters more context about your career achievements and connections. A clear presentation here ensures recruiters can easily reach you with job opportunities.
- Professional Summary: Use this space to craft a focused snapshot of your experience as an Excel data analyst. Highlight specific strengths like your knack for transforming raw data into actionable insights and driving business decisions. Mention your analytical skills and abilities in creating concise, informative reports. This summary serves as a hook—encouraging recruiters to read further to explore the depth of experience highlighted in your resume.
- Skills: Make this section a list of specific Excel functions you excel in, such as pivot tables, VLOOKUP, and data validation. Include any experience with advanced tools like Power Query or Power Pivot to demonstrate the breadth of your expertise. Reinforce your proficiency by mentioning any data visualization techniques or analytical tools you have mastered that are pertinent to an Excel data analyst role.
- Work Experience: Detail your previous roles by illustrating your impact with specific examples. Discuss how you effectively used Excel to contribute to decision-making processes and optimized workflows. Consider highlighting a particular project where your data analysis significantly improved efficiency or resolved a long-standing issue within the organization. Such examples show the practical application of your Excel skills.
- Education: Include your degrees, emphasizing any courses or electives related to data analysis or Excel. Mention any certifications from recognized institutions like Microsoft to enhance credibility. This education section not only showcases your foundational knowledge but also creates a link to your technical skills section, supporting your overall proficiency in data analysis.
- Projects/Portfolio: Present real-world examples of projects where you’ve made a considerable impact through data analysis. Whether you improved data processes or developed dashboard visualizations, these examples reinforce your practical experience. Offering links to an online portfolio can provide recruiters with tangible proof of your abilities, setting you apart from other candidates.
With these sections covered in more depth, let's transition to discussing the ideal resume format for organizing this information effectively, ensuring your key qualifications shine through to potential employers.
Which resume format to choose
Creating a standout resume as an excel data analyst means focusing on features that best showcase your expertise. Start by selecting the reverse-chronological format. This format gives a clear picture of your professional journey, allowing employers to easily track your career and identify the most recent roles you’ve held. For data-centric roles, employers appreciate seeing a clear and logical progression of your skills and experiences.
Font choice might seem minor, but it impacts the overall readability of your resume. Opt for modern options like Rubik, Lato, and Montserrat. These fonts offer a sleek look that aligns with the precision demanded in data analysis while remaining easy on the eyes. Such clarity and professionalism subtly reinforce your attention to detail, which is critical in data-related positions.
When it comes to file type, always choose PDF. PDFs maintain the integrity of your formatting and design, ensuring that your resume appears exactly as intended across all devices and platforms. This reliability is crucial, as inconsistent formatting can distract from your qualifications and expertise.
Finally, consider your margins. Keeping them around one inch on all sides ensures your resume has a clean, organized appearance with ample white space. This layout not only enhances readability but also demonstrates your organizational skills and ability to present data clearly, which are key attributes of an excel data analyst.
By integrating these thoughtful elements, your resume becomes a powerful tool that effectively highlights your strengths and career trajectory in a way that's tailored to excel data analysis. This approach ensures your unique skills and experiences catch the eye of potential employers.
How to write a quantifiable resume experience section
Your Excel data analyst resume should clearly highlight your analytical skills and achievements. Starting with your most recent job and working backward, this reverse chronological order helps employers quickly recognize your relevant experience. By focusing on the last 10-15 years, you emphasize positions that showcase your data expertise. Carefully tailoring your resume to each job ad, you highlight experiences that align with the job description. Using action words like analyzed, improved, optimized, or automated helps vividly describe your role.
By quantifying your achievements, you demonstrate the tangible value you brought to past employers. This approach in the experience section proves your capabilities through concrete successes, illustrating why you’re a great fit for the company.
Here's a resume experience example for an Excel data analyst:
 06/2018 - 09/2023
- •Increased data processing efficiency by 30% through the development of automated Excel macros.
- •Designed dynamic dashboards that improved data visibility, reducing reporting time by 40%.
- •Performed deep-dive analysis leading to a 15% cost saving on company procurement strategies.
- •Developed and implemented a scalable data management system that improved data accuracy by 25%.
In this experience section, the focus is not just on what you did, but on the impact you made. Employers are interested in how you bring value, and this format effectively conveys that. By quantifying achievements, you make your skills and contributions clear, while tailoring ensures alignment with the employer's needs. The use of action words adds energy to your descriptions, making each bullet point impactful and easy to understand. This cohesive section weaves together a compelling story of progress and results, making a strong impression on potential employers.
Technology-Focused resume experience section
A technology-focused data analyst resume experience section should highlight your ability to leverage tech tools like Excel, SQL, and data visualization software to generate meaningful insights. Start by presenting your job title, workplace, and dates to set the stage. Then, use bullet points to illustrate how you've applied these tools to improve processes and drive business outcomes, showcasing your impact through examples of past projects.
Each bullet point should connect your technical skills with tangible achievements. Quantify your successes with percentages to show improvements or provide dollar amounts for cost savings. Share examples of specific projects or challenges where you made a difference, illustrating how your efforts led to better decisions or increased efficiency. This approach not only demonstrates your expertise but also tells the story of how you apply your skills effectively in real-world situations, emphasizing your ability to solve problems and deliver results.
Data Analyst
Tech Innovators Inc.
January 2020 - Present
- Developed data models in Excel that improved sales forecasting accuracy by 20% for a technology firm.
- Automated weekly data reports using advanced Excel macros and VBA, cutting report generation time by 50%, showcasing your efficiency in data management.
- Explored customer data deeply, leading to a new segmentation strategy that boosted retention rates by 15%, highlighting your impact on customer insights.
- Teamed up with IT to move legacy data to a modern cloud platform, enhancing data accessibility and security, underscoring your teamwork and forward-thinking approach.
Innovation-Focused resume experience section
An innovation-focused Excel Data Analyst resume experience section should highlight how your analytical skills have driven meaningful change and improvements. Clearly communicate the role you played and the innovative outcomes you achieved, using numbers to help potential employers visualize your impact. By showcasing the ways you've employed data analysis to pioneer new methods, tools, or processes, you underline your ability to boost operational efficiency and make a real difference.
Include detailed examples of projects you've led or contributed to, demonstrating how your insights led to increased productivity or cost savings. Highlight instances where your innovative analysis provided tangible benefits, and emphasize collaboration with teams or departments, as diverse insights often fuel successful innovation. Ensure your bullet points are concise but descriptive, effectively illustrating your proactive contributions and strategic thinking within the organization.
Data Analyst
Tech Innovators Inc.
June 2020 - May 2023
- Developed a new reporting system that improved data processing time by 30%
- Analyzed customer data leading to a 15% increase in sales by identifying key trends
- Led a cross-functional team to introduce a predictive analytics tool, enhancing decision-making processes
- Implemented automation features that reduced manual reporting efforts by 20 hours per month
Achievement-Focused resume experience section
An achievement-focused resume experience section for an Excel data analyst should clearly demonstrate how your skills have made a positive impact in your previous roles. Begin by highlighting the specific ways your expertise has led to improvements, using numbers to quantify your achievements. To maintain engagement, employ strong action verbs and keep your bullet points concise yet informative, ensuring they closely align with the job you’re seeking.
Center on your accomplishments rather than just listing duties, which helps to bring out the tangible benefits of your contributions. Provide statistics to showcase improvements like enhanced efficiency or accuracy, illustrating your ability to drive success through Excel. This approach not only underscores your technical skills but also your capacity to benefit a team or company. A well-crafted experience section positions you as a standout candidate with valuable expertise.
Data Analyst
Tech Solutions Inc.
2019 - 2023
- Boosted data processing efficiency by 30% using advanced Excel formulas and automation techniques.
- Created dashboards that cut reporting time by 25%, streamlining daily, weekly, and monthly updates.
- Worked with teams to fix data issues, improving data accuracy by 15% across the board.
- Guided over 50 colleagues in Excel best practices, raising overall team skills and productivity.
Skills-Focused resume experience section
A skills-focused Excel data analyst resume experience section should highlight your technical expertise and demonstrate how you've effectively applied these skills in professional scenarios. Begin with your work period, job title, and workplace to set the stage. Then, break your responsibilities into bullet points that showcase your key skills. Each bullet should emphasize a different skill or accomplishment, effectively reflecting your proficiency in Excel and data analysis. Use straightforward language and include quantifiable achievements to clarify the value you brought to your previous role.
When crafting these bullet points, think about how you've used Excel to enhance tasks such as improving data accuracy, automating processes, or supporting important decisions. Highlight the specific tools, functions, or methods you employed, such as pivot tables, v-lookups, or macros, to demonstrate your practical skills. Connect the cause-and-effect relationship by showing how your expertise led to positive outcomes, like increased efficiency or cost reductions. This approach not only underscores your competence with Excel but also highlights your ability to solve problems effectively and make a significant impact.
Excel Data Analyst
XYZ Corporation
June 2020 - September 2023
- Automated monthly sales reports with advanced Excel macros, reducing manual work by 15 hours each month.
- Designed and managed complex pivot tables to summarize quarterly financial data, enhancing data accuracy by 10%.
- Streamlined data entry processes using VLOOKUP and INDEX MATCH functions, leading to a 25% reduction in errors.
- Collaborated with the finance team to create interactive dashboards with real-time data visualizations, aiding strategic decision-making.
Write your excel data analyst resume summary section
A well-crafted resume summary for an Excel data analyst should spotlight your experience, skills, and the unique value you offer. This section is vital because it provides a snapshot of your professional story, helping potential employers quickly understand what sets you apart. The best way to describe yourself is to use concise, specific language that highlights your key contributions. In crafting an effective summary, consider this sample for an Excel data analyst:
This summary connects your technical skills with concrete achievements, making your strengths and accomplishments clear. Highlighting familiarity with tools like pivot tables and VLOOKUP showcases your technical expertise, while mentioning a specific percentage emphasizes your impact. A resume summary is about showcasing your value, distinguishing it from a resume objective, which focuses more on personal career goals. While a resume profile may describe your broader professional persona, a summary of qualifications simply lists skills. Each section serves its purpose, yet a well-crafted summary quickly shows why you are the standout candidate.
Listing your excel data analyst skills on your resume
A skills-focused Excel Data Analyst resume should highlight the core competencies that make you a valuable asset. Your skills can be featured in a dedicated section or woven into your experience and summary. This flexibility allows you to present your abilities in a way that resonates with hiring managers, ensuring you emphasize both your strengths and hard skills. While strengths and soft skills reveal your personality and collaboration abilities, hard skills drive your technical expertise in areas like Excel proficiency and data analysis.
Incorporating your skills and strengths as resume keywords can enhance your visibility to hiring managers and automated systems. These keywords demonstrate what you offer, setting you apart from other candidates. For example, here's a skills section tailored for an Excel Data Analyst resume in JSON format:
This example effectively highlights specific, relevant skills that are crucial for the role. Each skill addresses essential aspects of data analysis, from technical manipulation to sophisticated presentation, ensuring your resume stands out.
Best hard skills to feature on your excel data analyst resume
Excel Data Analysts need hard skills that signal their capability to navigate complex datasets and derive actionable insights. Your skills should communicate proficiency in Excel and data management. Essential hard skills to feature include:
Hard Skills
- Advanced Microsoft Excel skills
- Data Cleaning and Preparation
- Data Modeling
- Pivot Tables and Charts
- VBA Programming
- Power BI and Power Query
- Statistical Analysis and Descriptive Statistics
- SQL and Database Management
- Data Visualization Techniques
- Spreadsheet Design and Formatting
- Regression Analysis
- Monte Carlo Simulations
- Forecasting Models
- Macros Development
- Dashboard Creation
Best soft skills to feature on your excel data analyst resume
Soft skills are vital for demonstrating your approach to teamwork and problem-solving. They show how you manage projects and interact with others. Important soft skills for an Excel Data Analyst include:
Soft Skills
- Critical Thinking
- Attention to Detail
- Problem-Solving
- Effective Communication
- Time Management
- Adaptability
- Teamwork and Collaboration
- Creativity
- Project Management
- Decision-Making
- Analytical Thinking
- Organizational Skills
- Patience and Tenacity
- Interpersonal Skills
- Flexibility
How to include your education on your resume
The education section is an important part of your Excel data analyst resume. It showcases your academic credentials and can set you apart from other candidates. Always tailor this section to the job you're applying for. Avoid including any irrelevant education. Focus on degrees or certifications that impress employers looking for analytical skills.
When listing your GPA on your resume, do so only if it is strong (typically 3.5 or above). If you graduated with honors such as cum laude, include this to highlight your academic achievements. Specify the degree you earned, the institution's name, and your graduation year.
Here’s how not to write it:
08/2015 - 05/2019 And here’s the right way:
09/2016 - 06/2020 - •Graduated cum laude
- •Relevant Coursework: Advanced Data Analysis, Statistical Modeling
This second example is effective because it highlights relevant education for an Excel data analyst. It clearly states the degree in data science, which is pertinent to the job. The GPA of 3.8 demonstrates academic excellence, and graduating cum laude further underlines this. Including relevant coursework adds depth, showing you have hands-on experience with data analysis and statistical modeling. This concise and targeted approach ensures employers see the qualifications they're seeking.
How to include excel data analyst certificates on your resume
Including a certificates section in an Excel data analyst resume is essential. It shows your skills and dedication to continuous learning. Start by listing the name of each certificate. Include the date you earned it. Add the issuing organization to ensure its credibility. Certificates can also be included in the header beside your name for quick reference.
Here's a good example:
This example is effective because it focuses on certificates relevant to the role of a data analyst. The titles of the certificates are clear and specific to skills needed in Excel and data analysis. Including the issuing organizations like Microsoft and Coursera adds credibility. This format makes it easy for potential employers to quickly see your qualifications.
Extra sections to include in your excel data analyst resume
Starting a career as an Excel data analyst might be your goal, and creating a strong resume is the first step. Including diverse sections such as languages, hobbies, volunteer work, and books can significantly enhance your profile. Let’s explore how these can be effectively incorporated and the benefits they bring.
- Language section — Encourage potential employers by showcasing your ability to communicate in multiple languages, which could be essential in a global workplace. Mentioning languages you speak can show that you have skills beyond just data analysis.
- Hobbies and interests section — Reveal your well-rounded personality and demonstrate how your outside interests keep you engaged and enthusiastic. Including hobbies can also highlight secondary skills that might benefit your role as an analyst.
- Volunteer work section — Show your community involvement and dedication to causes that are important to you by listing your volunteer experiences. Volunteer work can also expose your leadership, teamwork, and project management skills, which are valuable for an analyst.
- Books section — List relevant books you've read to exhibit your commitment to continuous learning and staying current in your field. This can provide insight into how invested you are in expanding your knowledge base beyond formal education.
By integrating these sections into your Excel data analyst resume, you are not just listing your skills but painting a complete picture of who you are. Potential employers will see the richness in your background, making you a more attractive candidate. Don't underestimate the power of a comprehensive, diverse resume in standing out from the crowd.
In Conclusion
In conclusion, crafting a standout resume as an Excel data analyst requires a strategic approach that mirrors the precision you employ in data analysis. By following a structured template, you can ensure that your resume is both visually appealing and organized, allowing your key achievements to shine. Prioritize aligning your resume content with what potential employers value most—in the same way, you align data patterns to reveal insights. Highlighting your technical skills in Excel, alongside tangible achievements, creates a powerful narrative of your expertise and impact. Choosing the right resume format, such as reverse-chronological, offers a clear view of your career progression and skills growth. Incorporating both hard and soft skills, as well as showcasing certifications, reinforces your commitment to professional development. Additionally, consider adding sections that display your language skills, hobbies, and volunteer work to present a well-rounded view of your capabilities. By quantifying your successes and utilizing clear, impactful language, you can captivate employers' attention and demonstrate how you stand out as a candidate. This holistic approach not only showcases your technical proficiency but also illustrates your problem-solving abilities and passion for continuous learning. Ultimately, an effective resume will unlock opportunities and pave the way toward achieving your career goals as an Excel data analyst.
Related Articles

Continue Reading
Check more recommended readings to get the job of your dreams.
Resume
Resources
Tools
© 2026. All rights reserved.
Made with love by people who care.