Data Reporting Analyst Resume Examples

Jul 18, 2024
|
12 min read
From data points to bullet points: How to write your data reporting analyst resume that stands out. Learn tips, examples, and common mistakes to secure interviews.
Rated by 348 people
 05/2019 - 09/2023
- •Led a data analytics team to streamline data collection processes, resulting in a 30% increase in efficiency and a 25% reduction in errors.
- •Developed custom data reporting solutions for disaster recovery projects that enhanced real-time decision making and improved response times by 18%.
- •Collaborated with various stakeholders to ensure data accuracy and integrity, resulting in improved grant management and compliance by 15%.
- •Conducted data analysis for statewide post-disaster projects using SQL and Python, providing actionable insights that led to a 20% better resource allocation.
- •Analyzed post-disaster housing needs and trends to support strategic planning, which resulted in a robust approach benefiting over 1,500 affected families.
- •Performed data visualization for disaster impact reports, increasing stakeholder engagement and understanding by 35%.
03/2015 - 04/2019 - •Created comprehensive data reports for housing reconstruction projects, facilitating better management and execution of 120+ projects.
- •Enabled real-time tracking and analysis of rehabilitation projects, significantly improving project completion rate by 22%.
- •Designed and implemented data validation protocols that improved data quality and reduced errors by 30%.
- •Optimized data flow between multiple departments, resulting in seamless operations and a 15% improvement in cross-functional collaboration.
- •Visualized complex datasets, transforming them into accessible and actionable insights, enhancing project stakeholders' decision-making capacity by 40%.
06/2011 - 02/2015 - •Managed and analyzed data for multi-year disaster recovery projects, ensuring timely and accurate reporting that led to better policy decisions.
- •Continually monitored and updated project data, increasing data integrity and reliability by 25%.
- •Compiled detailed data on housing recovery and municipal infrastructure projects, supporting over 50 grant applications and resulting in additional funding worth $3M.
- •Acquired and processed data from various external sources to enhance the scope and depth of analysis, resulting in more comprehensive recovery plans.
- •Facilitated training for junior analysts on data collection and reporting procedures, improving team proficiency and output by 15%.
01/2008 - 05/2011 - •Conducted data-driven research to support post-disaster recovery initiatives, producing detailed reports that improved response strategies by 20%.
- •Collaborated with federal and state agencies to compile and analyze data, ensuring comprehensive coverage and accuracy in disaster reports.
- •Developed predictive models for disaster impact assessment, which led to proactive measures saving $2M in potential damages.
- •Supported the creation of a centralized data repository, effectively increasing data availability and ease of access for all stakeholders.
 01/2009 - 01/2011 01/2005 - 01/2009
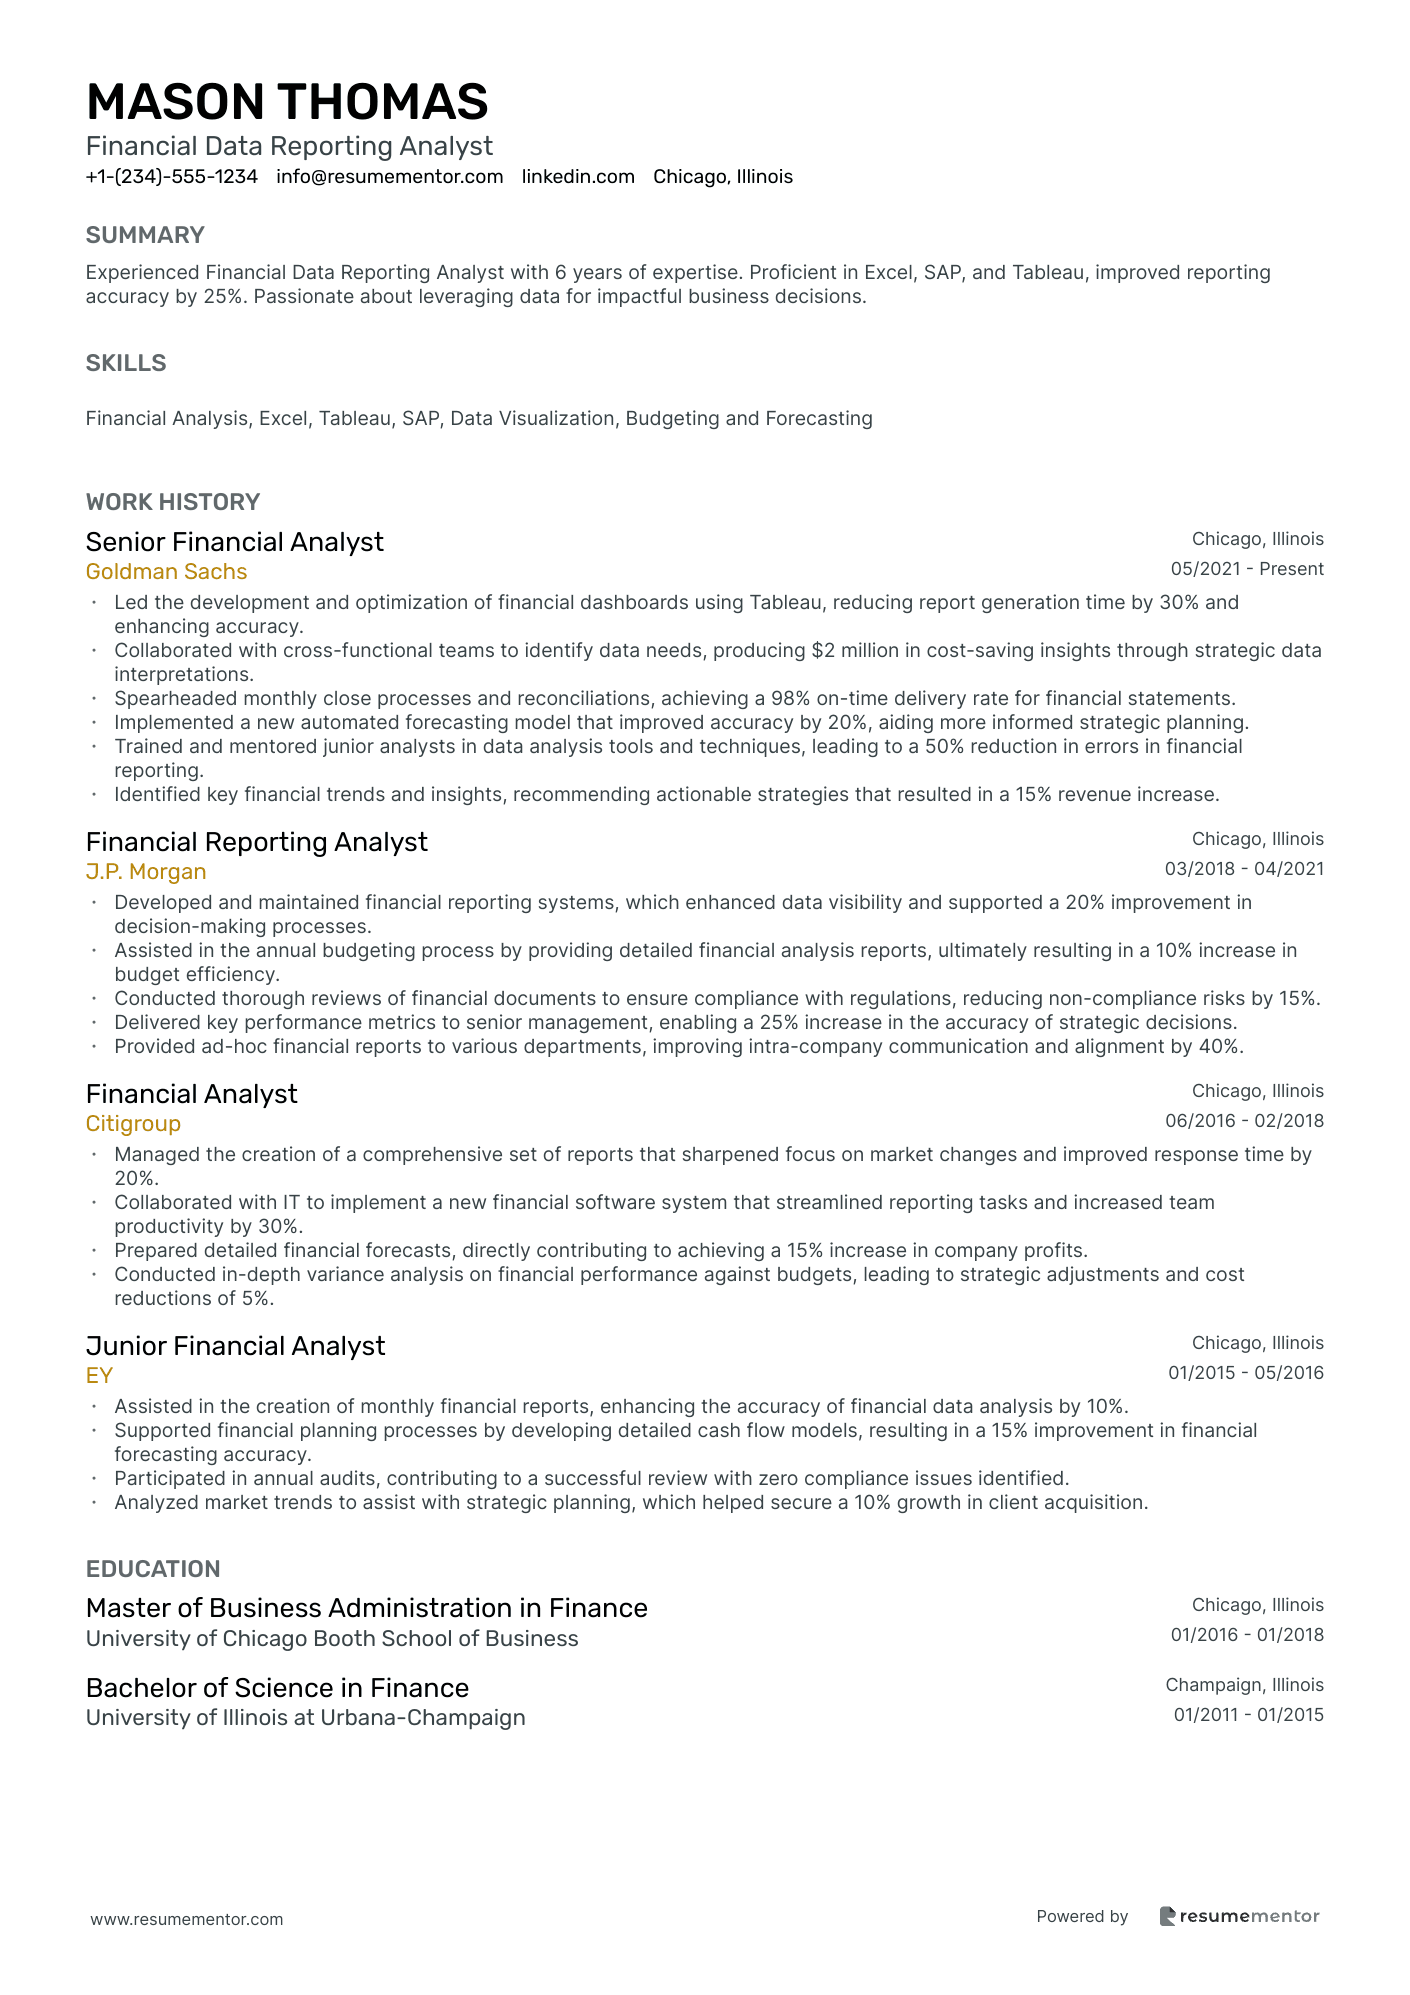
Financial Data Reporting Analyst
Healthcare Data Reporting Analyst
Marketing Data Reporting Analyst
Sales Data Reporting Analyst
HR Data Reporting Analyst
Insurance Data Reporting Analyst
Retail Data Reporting Analyst
Big Data Reporting Analyst
Risk Data Reporting Analyst
Regulatory Data Reporting Analyst

Financial Data Reporting Analyst resume sample
- •Led the development and optimization of financial dashboards using Tableau, reducing report generation time by 30% and enhancing accuracy.
- •Collaborated with cross-functional teams to identify data needs, producing $2 million in cost-saving insights through strategic data interpretations.
- •Spearheaded monthly close processes and reconciliations, achieving a 98% on-time delivery rate for financial statements.
- •Implemented a new automated forecasting model that improved accuracy by 20%, aiding more informed strategic planning.
- •Trained and mentored junior analysts in data analysis tools and techniques, leading to a 50% reduction in errors in financial reporting.
- •Identified key financial trends and insights, recommending actionable strategies that resulted in a 15% revenue increase.
- •Developed and maintained financial reporting systems, which enhanced data visibility and supported a 20% improvement in decision-making processes.
- •Assisted in the annual budgeting process by providing detailed financial analysis reports, ultimately resulting in a 10% increase in budget efficiency.
- •Conducted thorough reviews of financial documents to ensure compliance with regulations, reducing non-compliance risks by 15%.
- •Delivered key performance metrics to senior management, enabling a 25% increase in the accuracy of strategic decisions.
- •Provided ad-hoc financial reports to various departments, improving intra-company communication and alignment by 40%.
- •Managed the creation of a comprehensive set of reports that sharpened focus on market changes and improved response time by 20%.
- •Collaborated with IT to implement a new financial software system that streamlined reporting tasks and increased team productivity by 30%.
- •Prepared detailed financial forecasts, directly contributing to achieving a 15% increase in company profits.
- •Conducted in-depth variance analysis on financial performance against budgets, leading to strategic adjustments and cost reductions of 5%.
- •Assisted in the creation of monthly financial reports, enhancing the accuracy of financial data analysis by 10%.
- •Supported financial planning processes by developing detailed cash flow models, resulting in a 15% improvement in financial forecasting accuracy.
- •Participated in annual audits, contributing to a successful review with zero compliance issues identified.
- •Analyzed market trends to assist with strategic planning, which helped secure a 10% growth in client acquisition.
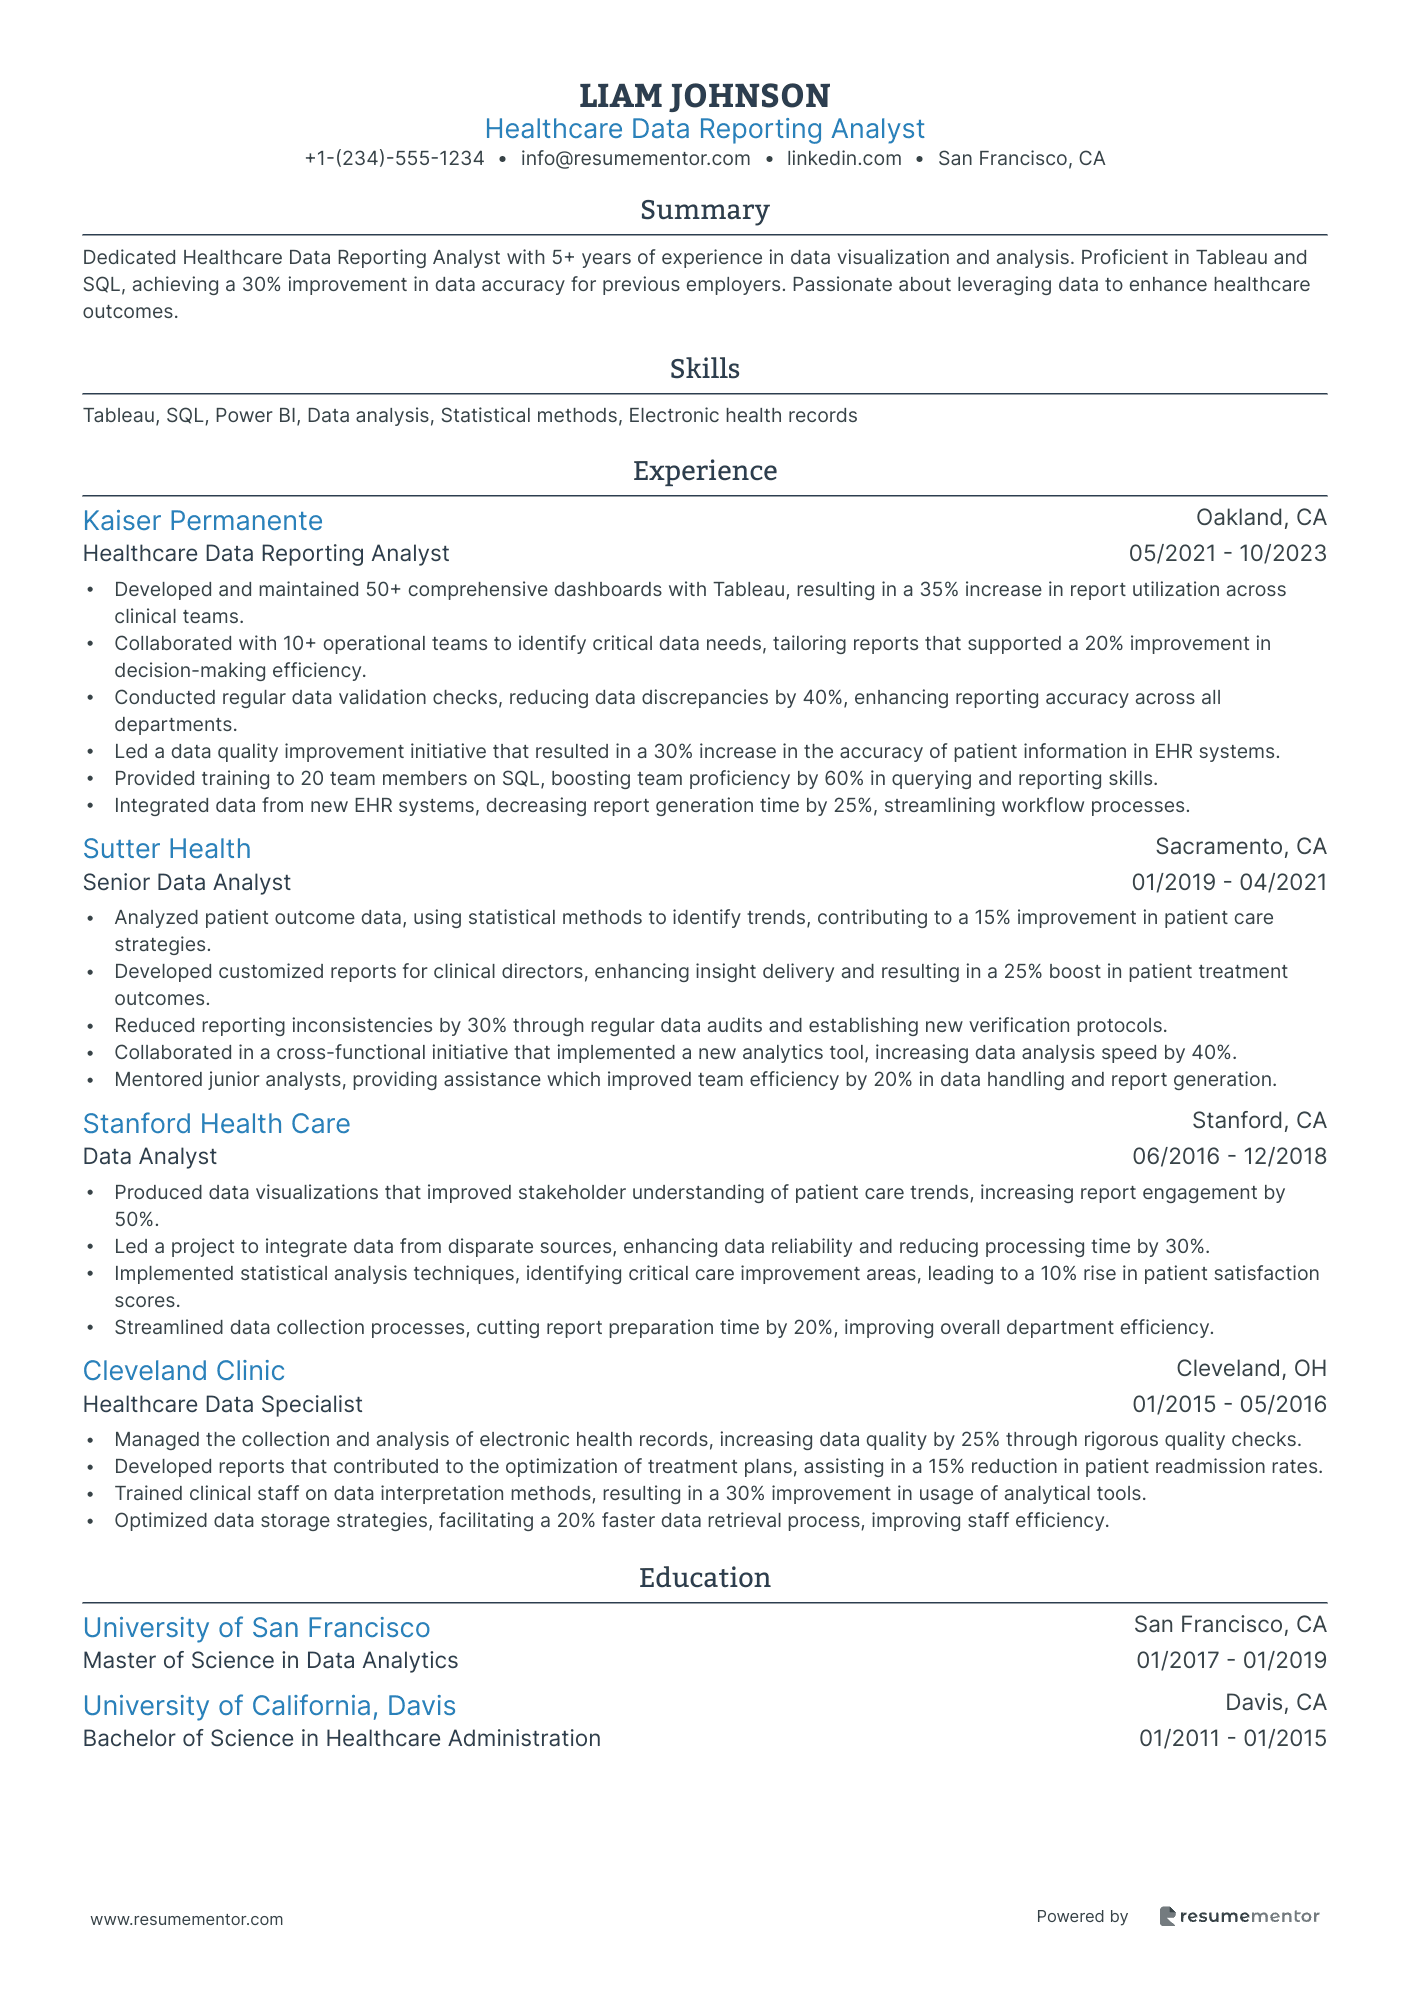
Healthcare Data Reporting Analyst resume sample
- •Developed and maintained 50+ comprehensive dashboards with Tableau, resulting in a 35% increase in report utilization across clinical teams.
- •Collaborated with 10+ operational teams to identify critical data needs, tailoring reports that supported a 20% improvement in decision-making efficiency.
- •Conducted regular data validation checks, reducing data discrepancies by 40%, enhancing reporting accuracy across all departments.
- •Led a data quality improvement initiative that resulted in a 30% increase in the accuracy of patient information in EHR systems.
- •Provided training to 20 team members on SQL, boosting team proficiency by 60% in querying and reporting skills.
- •Integrated data from new EHR systems, decreasing report generation time by 25%, streamlining workflow processes.
- •Analyzed patient outcome data, using statistical methods to identify trends, contributing to a 15% improvement in patient care strategies.
- •Developed customized reports for clinical directors, enhancing insight delivery and resulting in a 25% boost in patient treatment outcomes.
- •Reduced reporting inconsistencies by 30% through regular data audits and establishing new verification protocols.
- •Collaborated in a cross-functional initiative that implemented a new analytics tool, increasing data analysis speed by 40%.
- •Mentored junior analysts, providing assistance which improved team efficiency by 20% in data handling and report generation.
- •Produced data visualizations that improved stakeholder understanding of patient care trends, increasing report engagement by 50%.
- •Led a project to integrate data from disparate sources, enhancing data reliability and reducing processing time by 30%.
- •Implemented statistical analysis techniques, identifying critical care improvement areas, leading to a 10% rise in patient satisfaction scores.
- •Streamlined data collection processes, cutting report preparation time by 20%, improving overall department efficiency.
- •Managed the collection and analysis of electronic health records, increasing data quality by 25% through rigorous quality checks.
- •Developed reports that contributed to the optimization of treatment plans, assisting in a 15% reduction in patient readmission rates.
- •Trained clinical staff on data interpretation methods, resulting in a 30% improvement in usage of analytical tools.
- •Optimized data storage strategies, facilitating a 20% faster data retrieval process, improving staff efficiency.
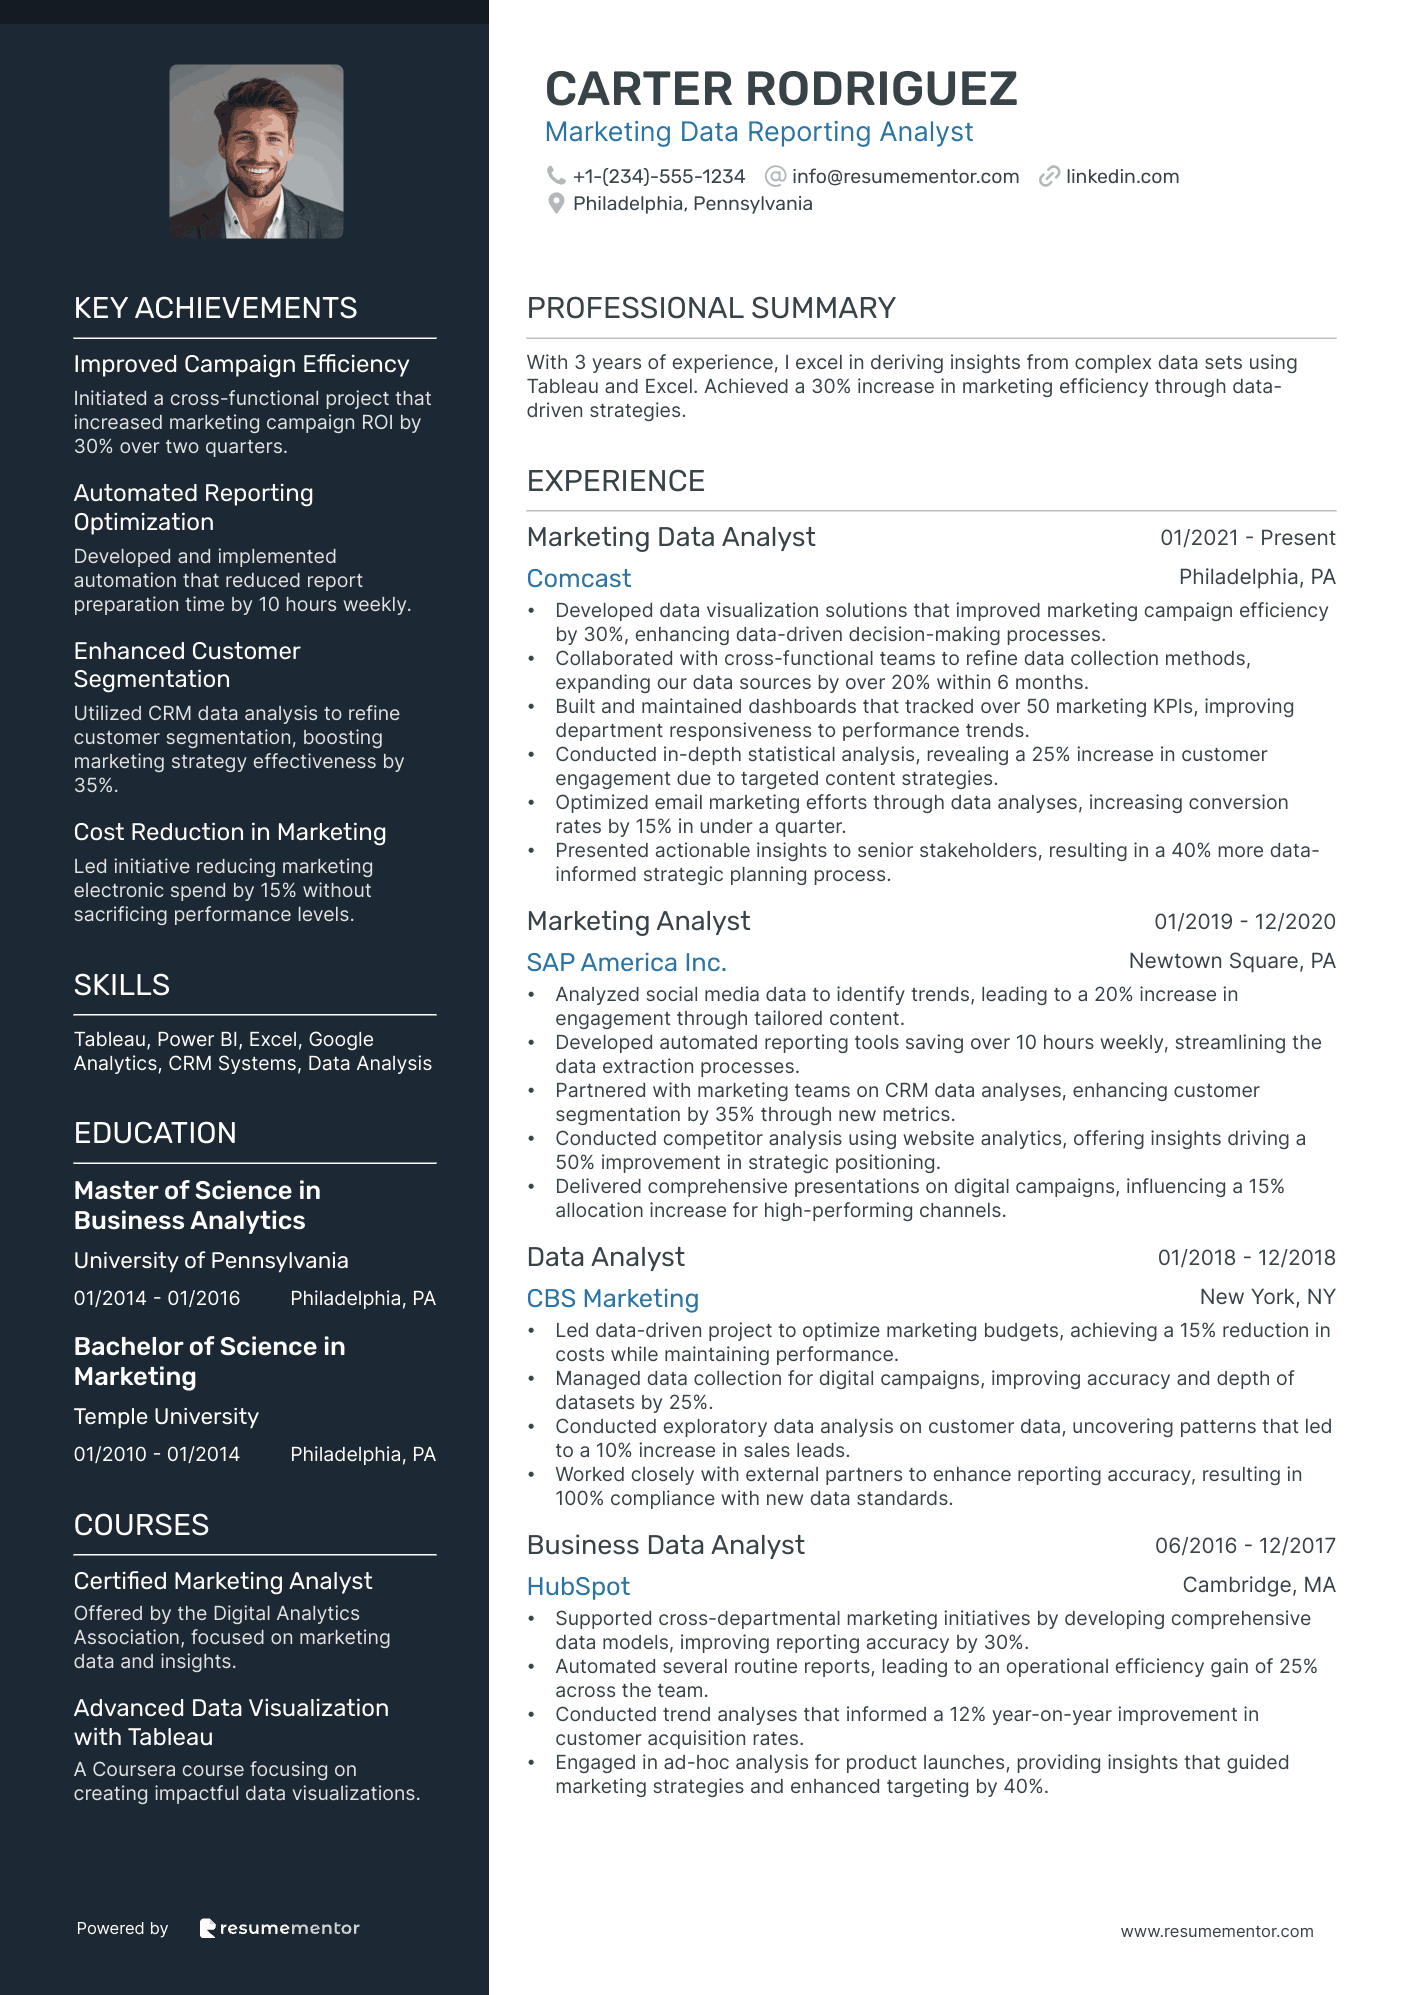
Marketing Data Reporting Analyst resume sample
- •Developed data visualization solutions that improved marketing campaign efficiency by 30%, enhancing data-driven decision-making processes.
- •Collaborated with cross-functional teams to refine data collection methods, expanding our data sources by over 20% within 6 months.
- •Built and maintained dashboards that tracked over 50 marketing KPIs, improving department responsiveness to performance trends.
- •Conducted in-depth statistical analysis, revealing a 25% increase in customer engagement due to targeted content strategies.
- •Optimized email marketing efforts through data analyses, increasing conversion rates by 15% in under a quarter.
- •Presented actionable insights to senior stakeholders, resulting in a 40% more data-informed strategic planning process.
- •Analyzed social media data to identify trends, leading to a 20% increase in engagement through tailored content.
- •Developed automated reporting tools saving over 10 hours weekly, streamlining the data extraction processes.
- •Partnered with marketing teams on CRM data analyses, enhancing customer segmentation by 35% through new metrics.
- •Conducted competitor analysis using website analytics, offering insights driving a 50% improvement in strategic positioning.
- •Delivered comprehensive presentations on digital campaigns, influencing a 15% allocation increase for high-performing channels.
- •Led data-driven project to optimize marketing budgets, achieving a 15% reduction in costs while maintaining performance.
- •Managed data collection for digital campaigns, improving accuracy and depth of datasets by 25%.
- •Conducted exploratory data analysis on customer data, uncovering patterns that led to a 10% increase in sales leads.
- •Worked closely with external partners to enhance reporting accuracy, resulting in 100% compliance with new data standards.
- •Supported cross-departmental marketing initiatives by developing comprehensive data models, improving reporting accuracy by 30%.
- •Automated several routine reports, leading to an operational efficiency gain of 25% across the team.
- •Conducted trend analyses that informed a 12% year-on-year improvement in customer acquisition rates.
- •Engaged in ad-hoc analysis for product launches, providing insights that guided marketing strategies and enhanced targeting by 40%.
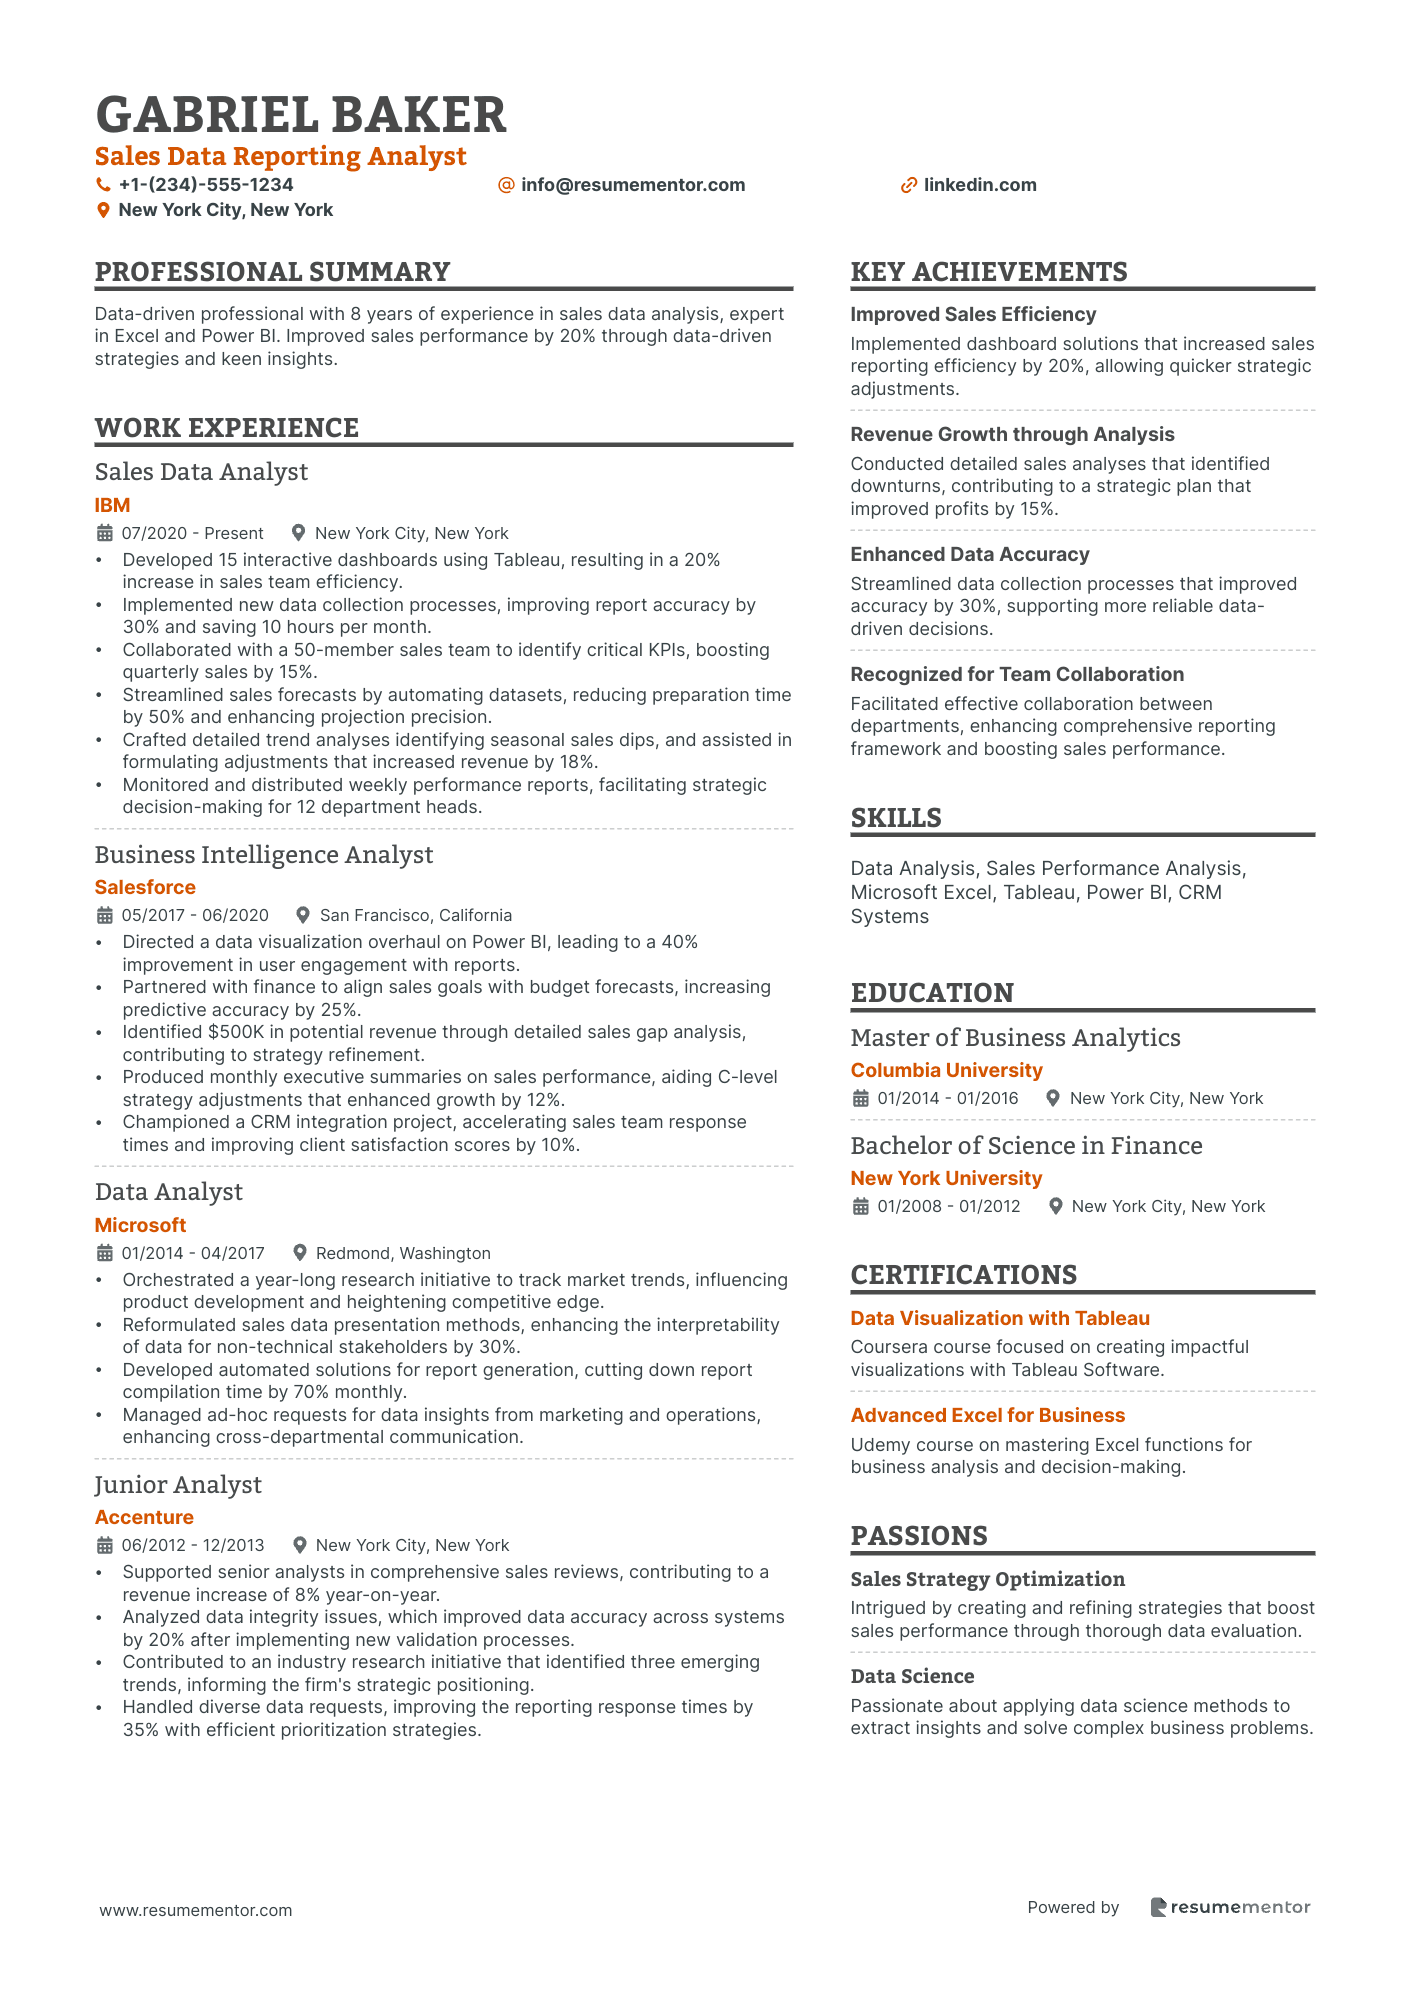
Sales Data Reporting Analyst resume sample
- •Developed 15 interactive dashboards using Tableau, resulting in a 20% increase in sales team efficiency.
- •Implemented new data collection processes, improving report accuracy by 30% and saving 10 hours per month.
- •Collaborated with a 50-member sales team to identify critical KPIs, boosting quarterly sales by 15%.
- •Streamlined sales forecasts by automating datasets, reducing preparation time by 50% and enhancing projection precision.
- •Crafted detailed trend analyses identifying seasonal sales dips, and assisted in formulating adjustments that increased revenue by 18%.
- •Monitored and distributed weekly performance reports, facilitating strategic decision-making for 12 department heads.
- •Directed a data visualization overhaul on Power BI, leading to a 40% improvement in user engagement with reports.
- •Partnered with finance to align sales goals with budget forecasts, increasing predictive accuracy by 25%.
- •Identified $500K in potential revenue through detailed sales gap analysis, contributing to strategy refinement.
- •Produced monthly executive summaries on sales performance, aiding C-level strategy adjustments that enhanced growth by 12%.
- •Championed a CRM integration project, accelerating sales team response times and improving client satisfaction scores by 10%.
- •Orchestrated a year-long research initiative to track market trends, influencing product development and heightening competitive edge.
- •Reformulated sales data presentation methods, enhancing the interpretability of data for non-technical stakeholders by 30%.
- •Developed automated solutions for report generation, cutting down report compilation time by 70% monthly.
- •Managed ad-hoc requests for data insights from marketing and operations, enhancing cross-departmental communication.
- •Supported senior analysts in comprehensive sales reviews, contributing to a revenue increase of 8% year-on-year.
- •Analyzed data integrity issues, which improved data accuracy across systems by 20% after implementing new validation processes.
- •Contributed to an industry research initiative that identified three emerging trends, informing the firm's strategic positioning.
- •Handled diverse data requests, improving the reporting response times by 35% with efficient prioritization strategies.
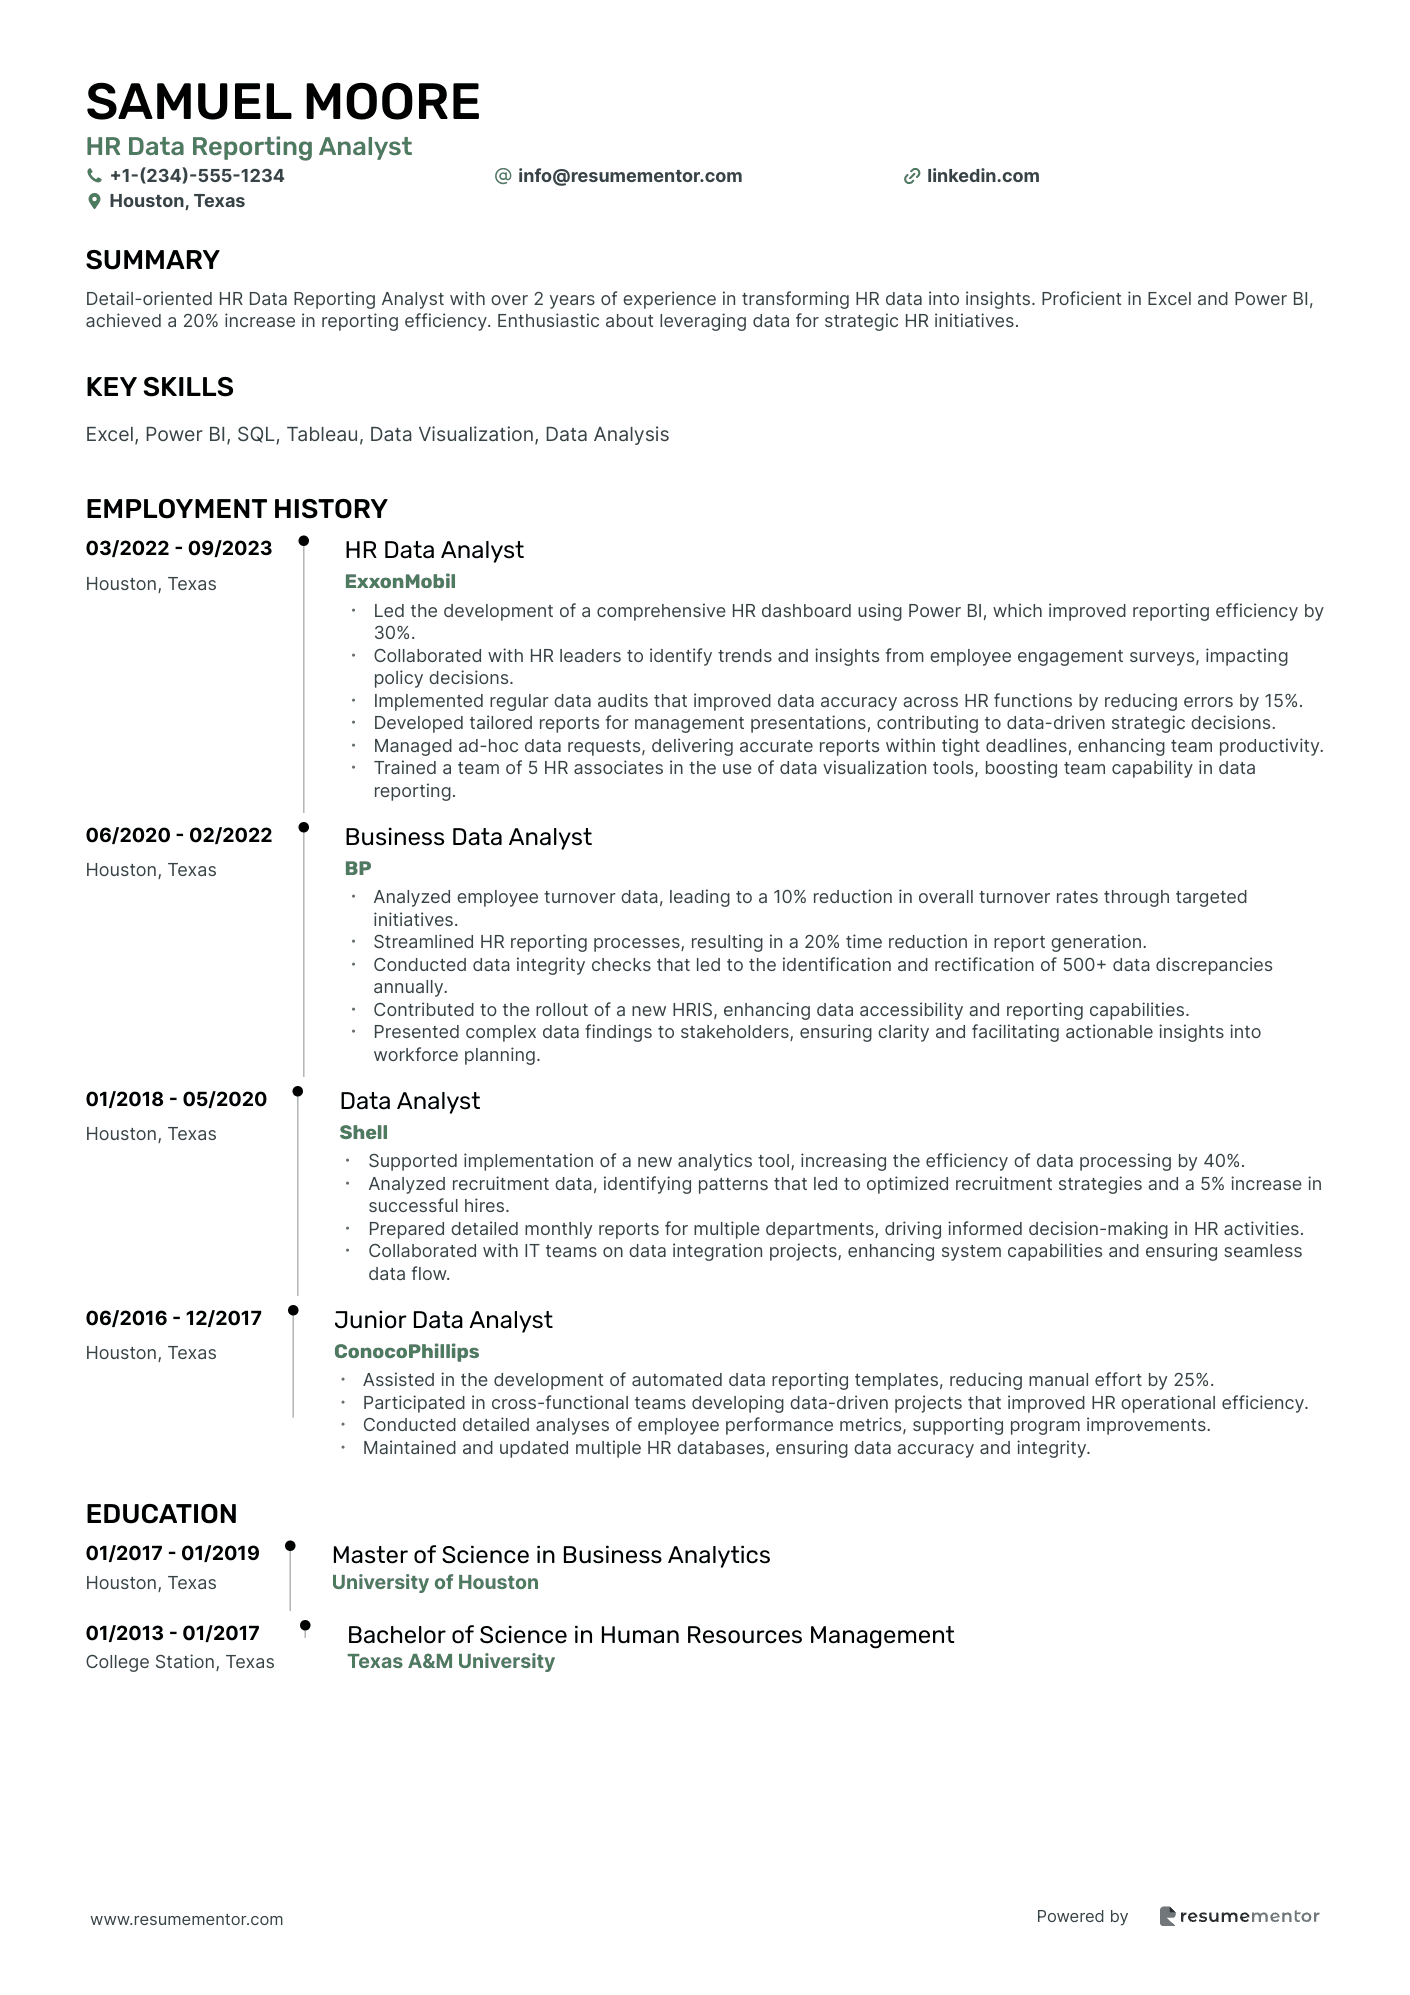
HR Data Reporting Analyst resume sample
- •Led the development of a comprehensive HR dashboard using Power BI, which improved reporting efficiency by 30%.
- •Collaborated with HR leaders to identify trends and insights from employee engagement surveys, impacting policy decisions.
- •Implemented regular data audits that improved data accuracy across HR functions by reducing errors by 15%.
- •Developed tailored reports for management presentations, contributing to data-driven strategic decisions.
- •Managed ad-hoc data requests, delivering accurate reports within tight deadlines, enhancing team productivity.
- •Trained a team of 5 HR associates in the use of data visualization tools, boosting team capability in data reporting.
- •Analyzed employee turnover data, leading to a 10% reduction in overall turnover rates through targeted initiatives.
- •Streamlined HR reporting processes, resulting in a 20% time reduction in report generation.
- •Conducted data integrity checks that led to the identification and rectification of 500+ data discrepancies annually.
- •Contributed to the rollout of a new HRIS, enhancing data accessibility and reporting capabilities.
- •Presented complex data findings to stakeholders, ensuring clarity and facilitating actionable insights into workforce planning.
- •Supported implementation of a new analytics tool, increasing the efficiency of data processing by 40%.
- •Analyzed recruitment data, identifying patterns that led to optimized recruitment strategies and a 5% increase in successful hires.
- •Prepared detailed monthly reports for multiple departments, driving informed decision-making in HR activities.
- •Collaborated with IT teams on data integration projects, enhancing system capabilities and ensuring seamless data flow.
- •Assisted in the development of automated data reporting templates, reducing manual effort by 25%.
- •Participated in cross-functional teams developing data-driven projects that improved HR operational efficiency.
- •Conducted detailed analyses of employee performance metrics, supporting program improvements.
- •Maintained and updated multiple HR databases, ensuring data accuracy and integrity.
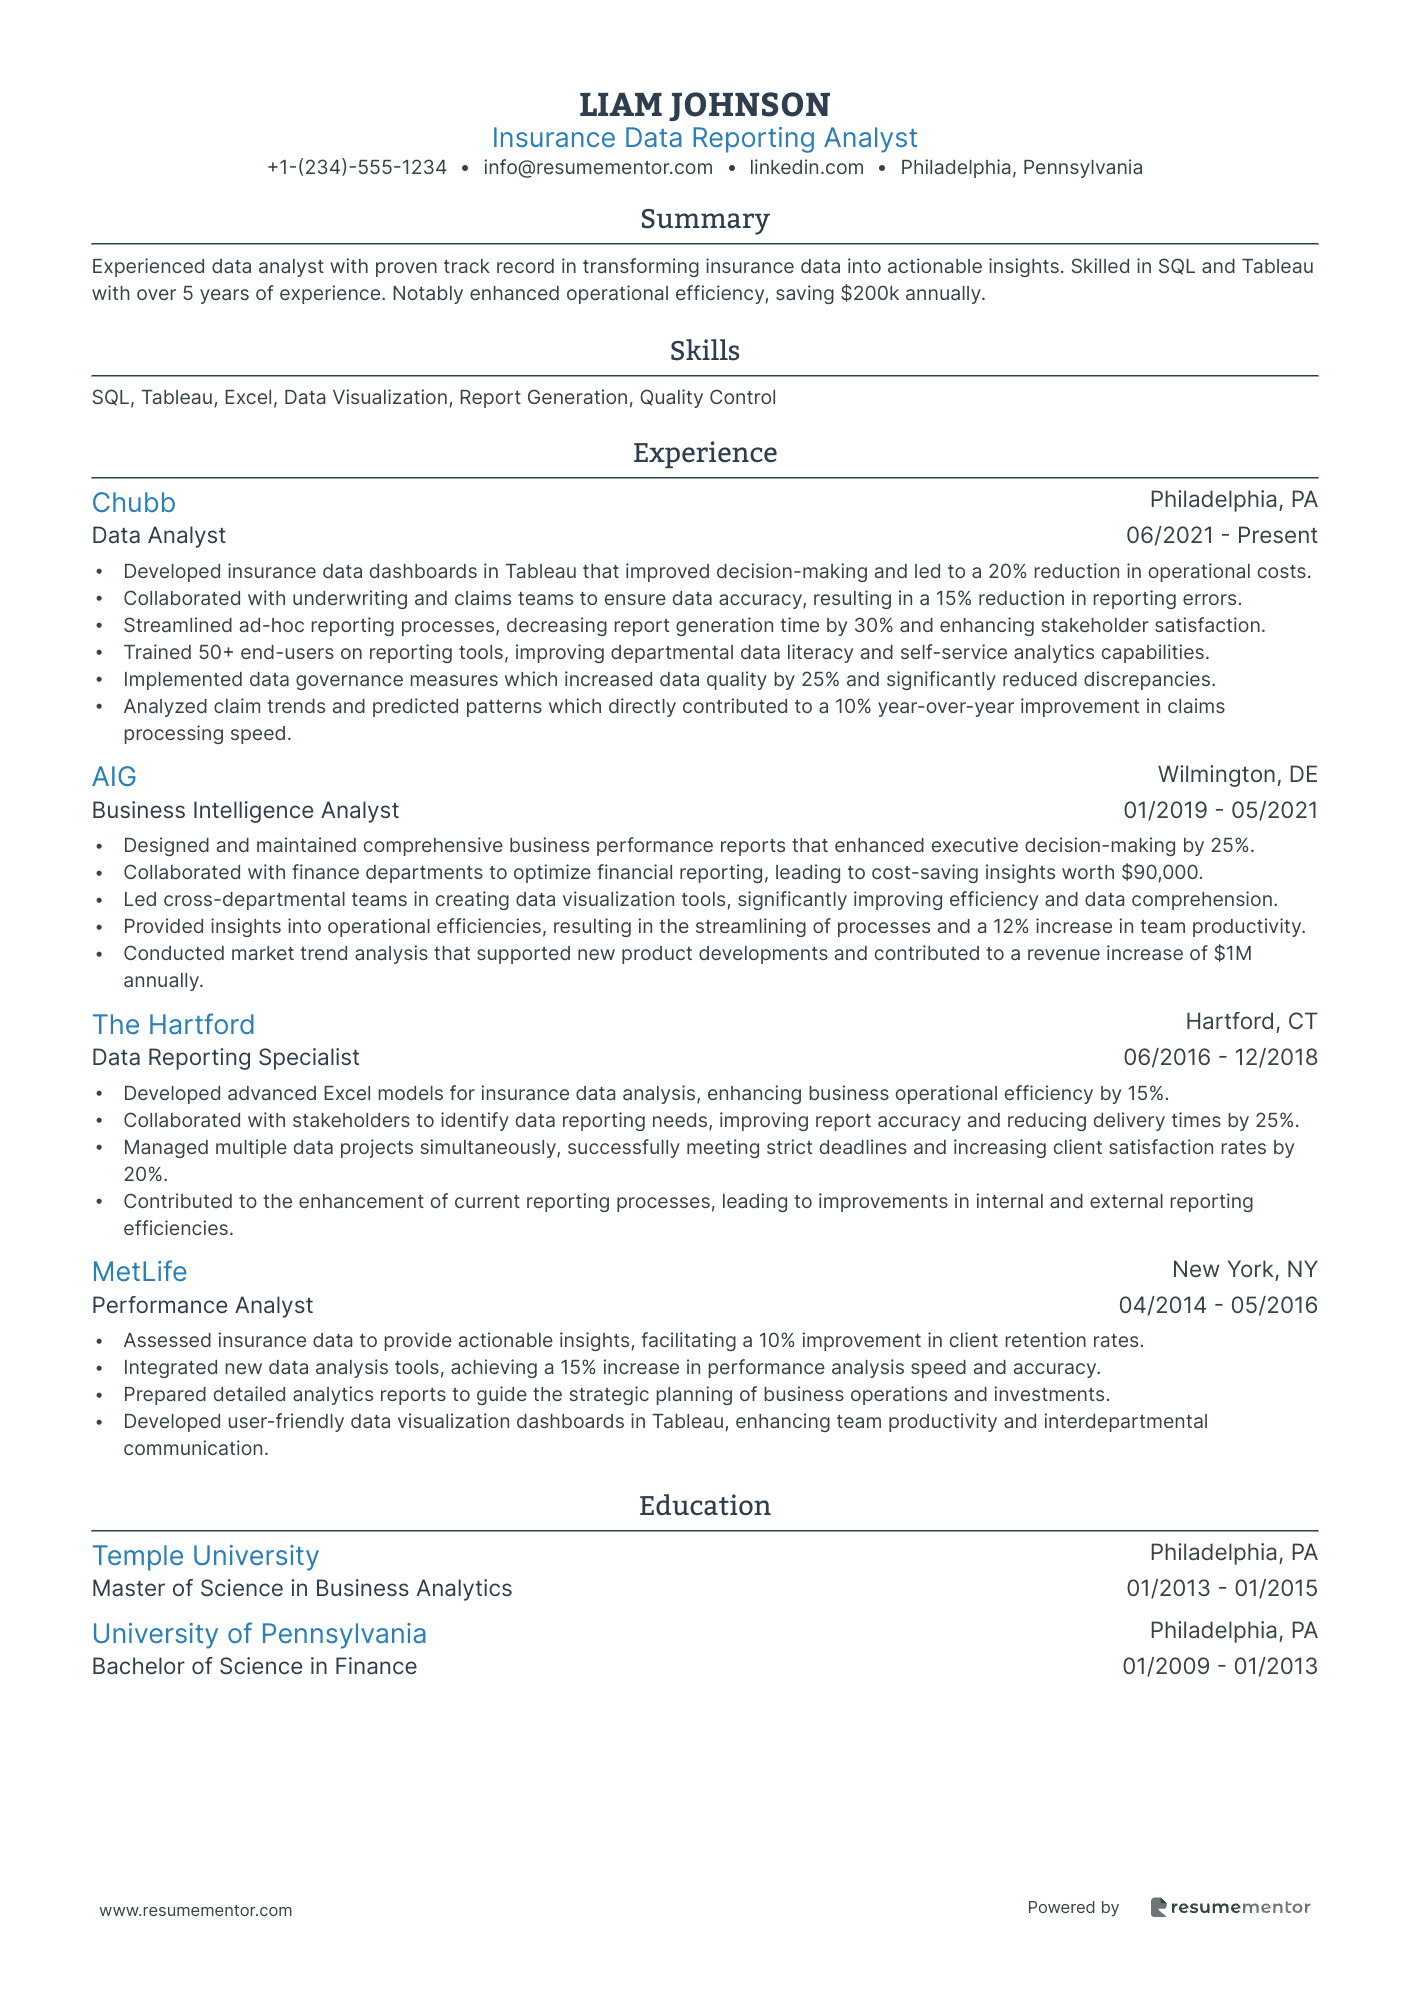
Insurance Data Reporting Analyst resume sample
- •Developed insurance data dashboards in Tableau that improved decision-making and led to a 20% reduction in operational costs.
- •Collaborated with underwriting and claims teams to ensure data accuracy, resulting in a 15% reduction in reporting errors.
- •Streamlined ad-hoc reporting processes, decreasing report generation time by 30% and enhancing stakeholder satisfaction.
- •Trained 50+ end-users on reporting tools, improving departmental data literacy and self-service analytics capabilities.
- •Implemented data governance measures which increased data quality by 25% and significantly reduced discrepancies.
- •Analyzed claim trends and predicted patterns which directly contributed to a 10% year-over-year improvement in claims processing speed.
- •Designed and maintained comprehensive business performance reports that enhanced executive decision-making by 25%.
- •Collaborated with finance departments to optimize financial reporting, leading to cost-saving insights worth $90,000.
- •Led cross-departmental teams in creating data visualization tools, significantly improving efficiency and data comprehension.
- •Provided insights into operational efficiencies, resulting in the streamlining of processes and a 12% increase in team productivity.
- •Conducted market trend analysis that supported new product developments and contributed to a revenue increase of $1M annually.
- •Developed advanced Excel models for insurance data analysis, enhancing business operational efficiency by 15%.
- •Collaborated with stakeholders to identify data reporting needs, improving report accuracy and reducing delivery times by 25%.
- •Managed multiple data projects simultaneously, successfully meeting strict deadlines and increasing client satisfaction rates by 20%.
- •Contributed to the enhancement of current reporting processes, leading to improvements in internal and external reporting efficiencies.
- •Assessed insurance data to provide actionable insights, facilitating a 10% improvement in client retention rates.
- •Integrated new data analysis tools, achieving a 15% increase in performance analysis speed and accuracy.
- •Prepared detailed analytics reports to guide the strategic planning of business operations and investments.
- •Developed user-friendly data visualization dashboards in Tableau, enhancing team productivity and interdepartmental communication.
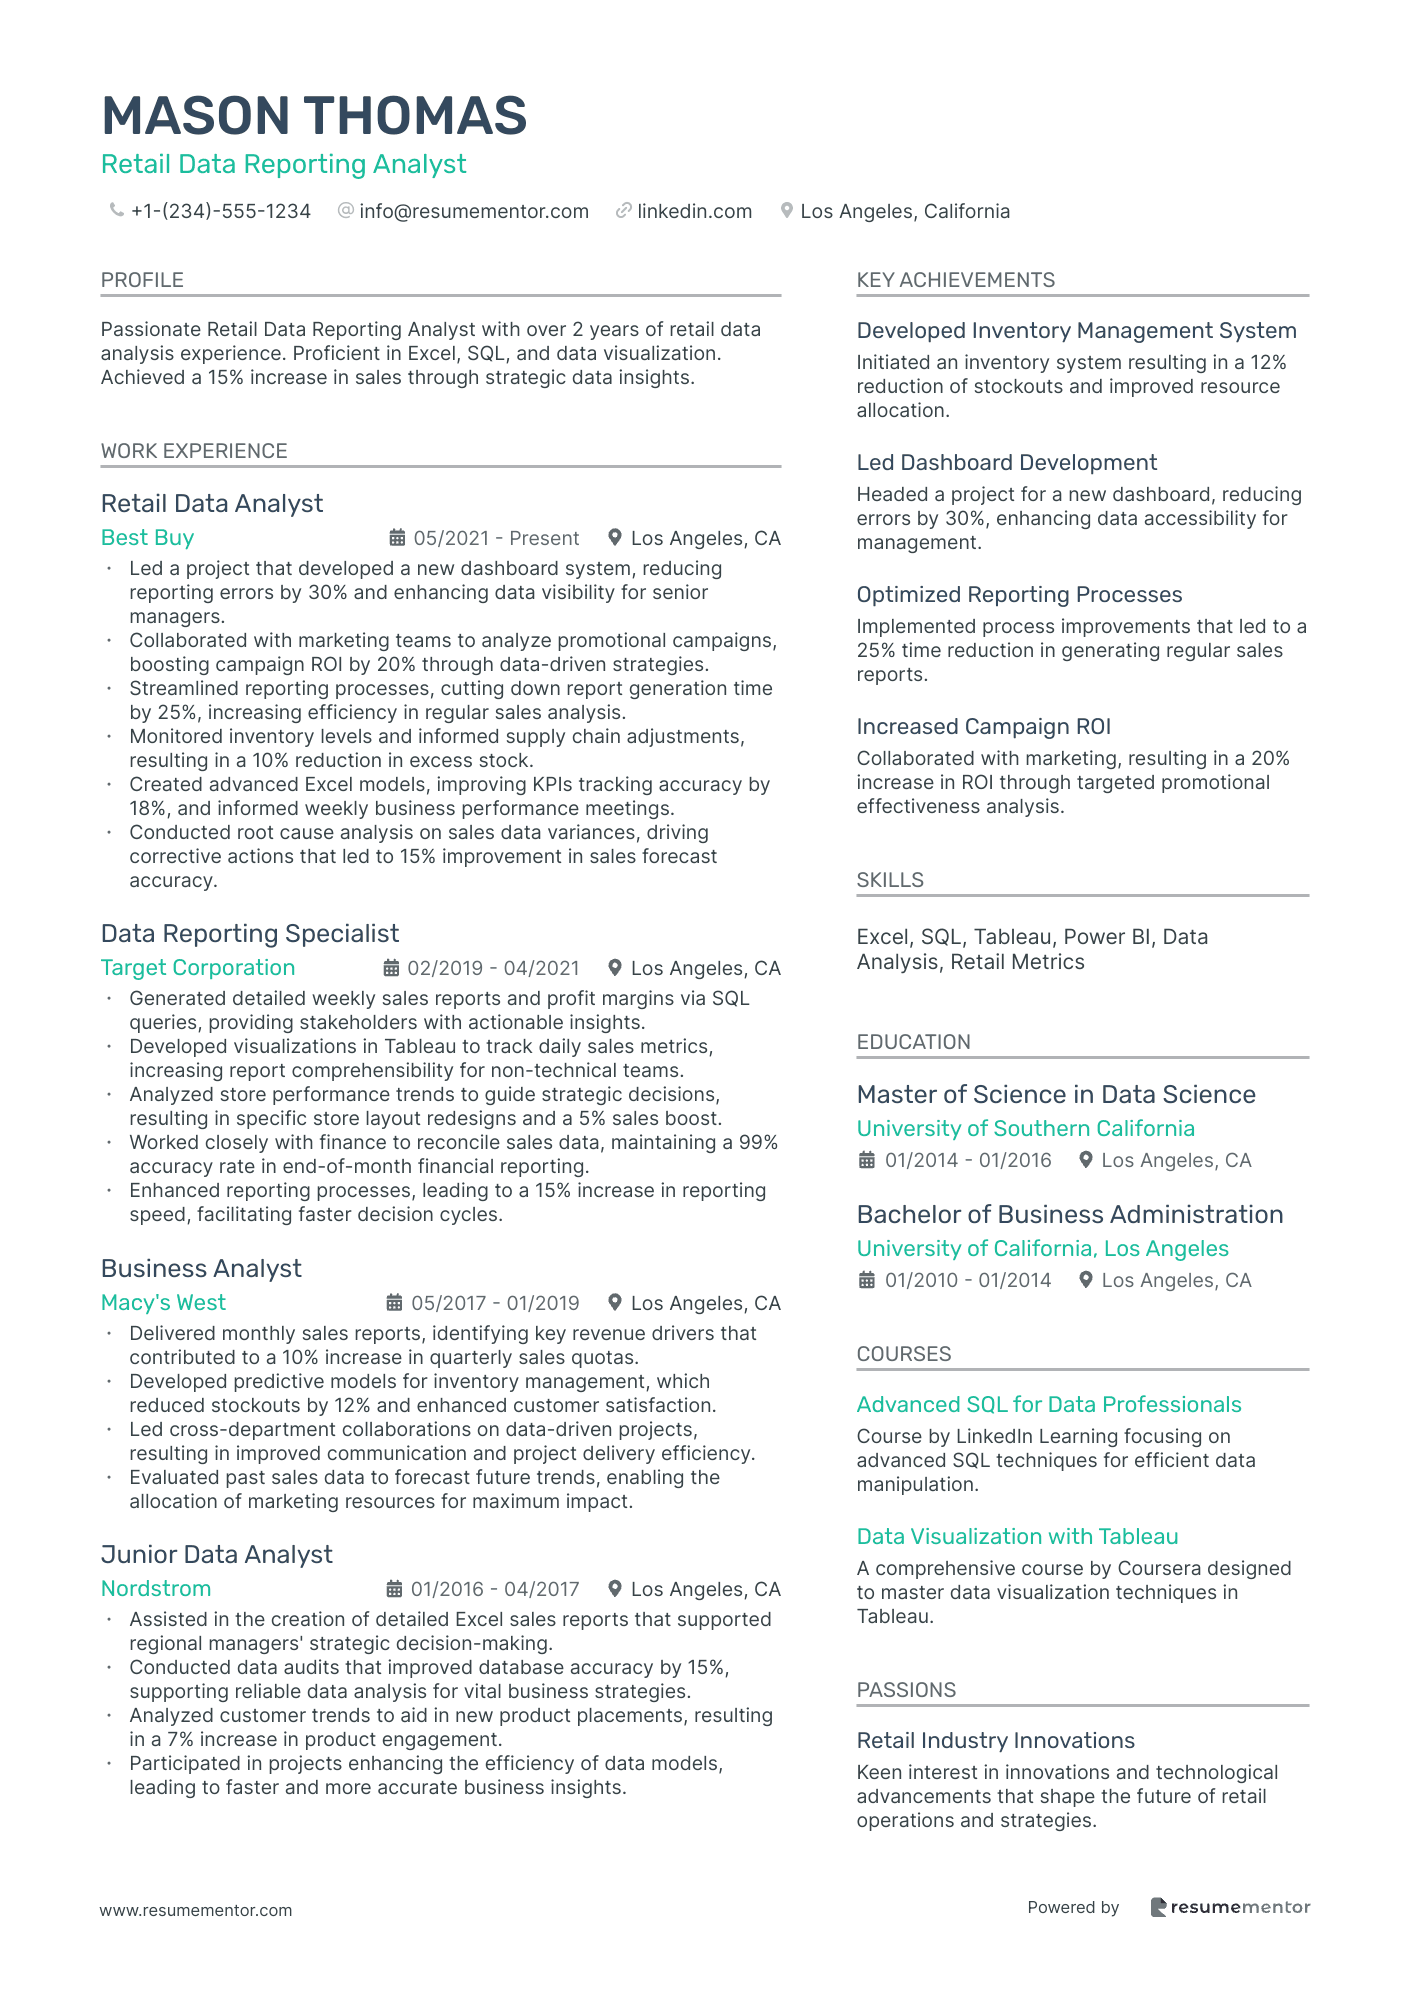
Retail Data Reporting Analyst resume sample
- •Led a project that developed a new dashboard system, reducing reporting errors by 30% and enhancing data visibility for senior managers.
- •Collaborated with marketing teams to analyze promotional campaigns, boosting campaign ROI by 20% through data-driven strategies.
- •Streamlined reporting processes, cutting down report generation time by 25%, increasing efficiency in regular sales analysis.
- •Monitored inventory levels and informed supply chain adjustments, resulting in a 10% reduction in excess stock.
- •Created advanced Excel models, improving KPIs tracking accuracy by 18%, and informed weekly business performance meetings.
- •Conducted root cause analysis on sales data variances, driving corrective actions that led to 15% improvement in sales forecast accuracy.
- •Generated detailed weekly sales reports and profit margins via SQL queries, providing stakeholders with actionable insights.
- •Developed visualizations in Tableau to track daily sales metrics, increasing report comprehensibility for non-technical teams.
- •Analyzed store performance trends to guide strategic decisions, resulting in specific store layout redesigns and a 5% sales boost.
- •Worked closely with finance to reconcile sales data, maintaining a 99% accuracy rate in end-of-month financial reporting.
- •Enhanced reporting processes, leading to a 15% increase in reporting speed, facilitating faster decision cycles.
- •Delivered monthly sales reports, identifying key revenue drivers that contributed to a 10% increase in quarterly sales quotas.
- •Developed predictive models for inventory management, which reduced stockouts by 12% and enhanced customer satisfaction.
- •Led cross-department collaborations on data-driven projects, resulting in improved communication and project delivery efficiency.
- •Evaluated past sales data to forecast future trends, enabling the allocation of marketing resources for maximum impact.
- •Assisted in the creation of detailed Excel sales reports that supported regional managers' strategic decision-making.
- •Conducted data audits that improved database accuracy by 15%, supporting reliable data analysis for vital business strategies.
- •Analyzed customer trends to aid in new product placements, resulting in a 7% increase in product engagement.
- •Participated in projects enhancing the efficiency of data models, leading to faster and more accurate business insights.
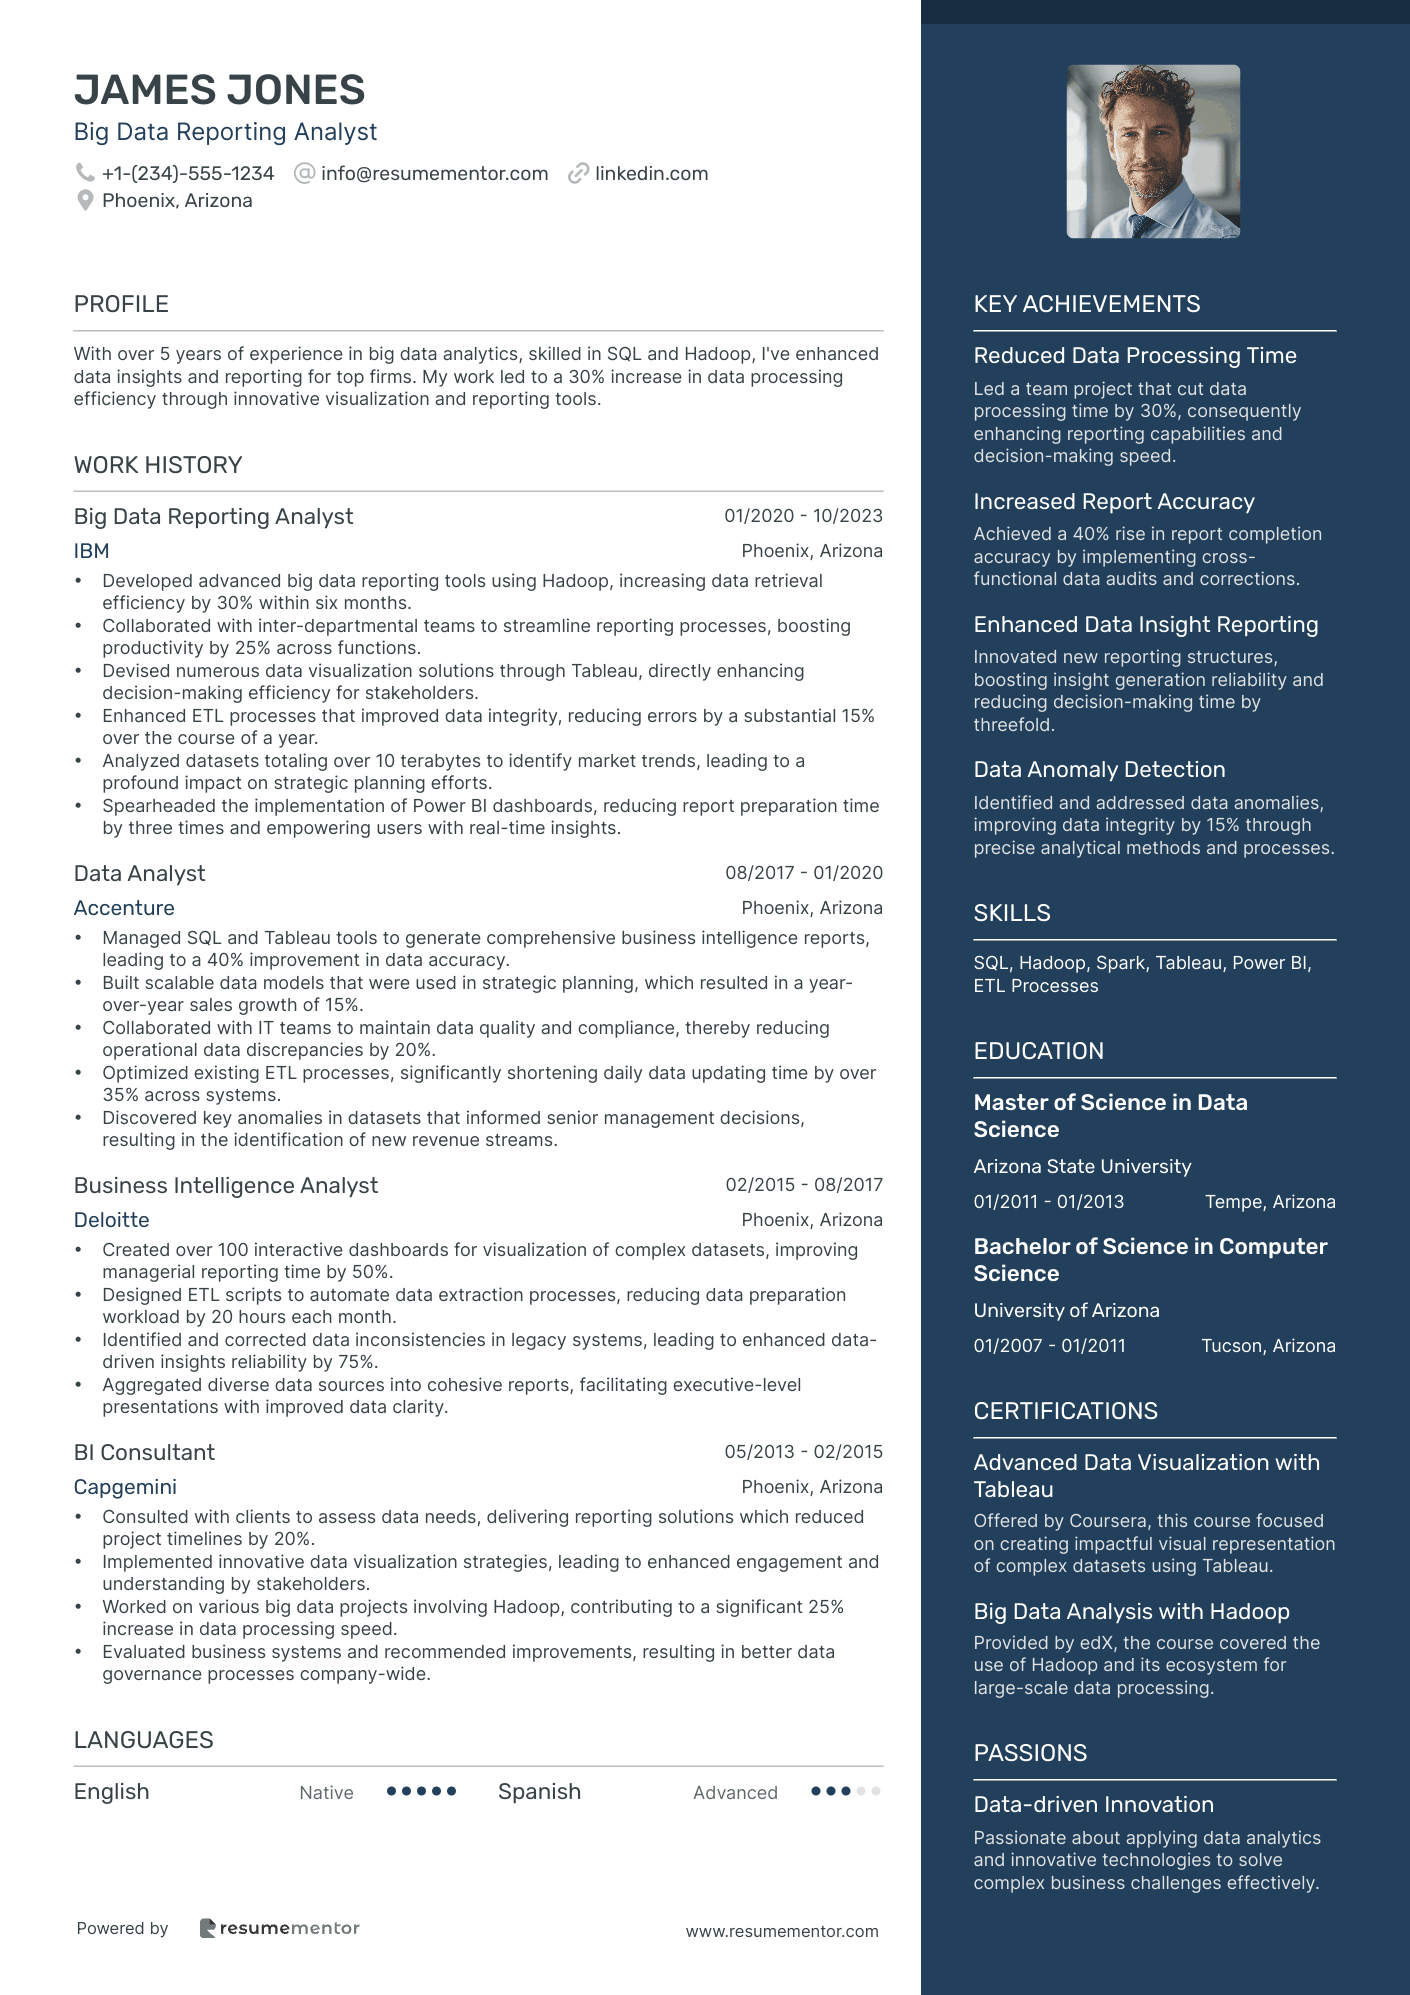
Big Data Reporting Analyst resume sample
- •Developed advanced big data reporting tools using Hadoop, increasing data retrieval efficiency by 30% within six months.
- •Collaborated with inter-departmental teams to streamline reporting processes, boosting productivity by 25% across functions.
- •Devised numerous data visualization solutions through Tableau, directly enhancing decision-making efficiency for stakeholders.
- •Enhanced ETL processes that improved data integrity, reducing errors by a substantial 15% over the course of a year.
- •Analyzed datasets totaling over 10 terabytes to identify market trends, leading to a profound impact on strategic planning efforts.
- •Spearheaded the implementation of Power BI dashboards, reducing report preparation time by three times and empowering users with real-time insights.
- •Managed SQL and Tableau tools to generate comprehensive business intelligence reports, leading to a 40% improvement in data accuracy.
- •Built scalable data models that were used in strategic planning, which resulted in a year-over-year sales growth of 15%.
- •Collaborated with IT teams to maintain data quality and compliance, thereby reducing operational data discrepancies by 20%.
- •Optimized existing ETL processes, significantly shortening daily data updating time by over 35% across systems.
- •Discovered key anomalies in datasets that informed senior management decisions, resulting in the identification of new revenue streams.
- •Created over 100 interactive dashboards for visualization of complex datasets, improving managerial reporting time by 50%.
- •Designed ETL scripts to automate data extraction processes, reducing data preparation workload by 20 hours each month.
- •Identified and corrected data inconsistencies in legacy systems, leading to enhanced data-driven insights reliability by 75%.
- •Aggregated diverse data sources into cohesive reports, facilitating executive-level presentations with improved data clarity.
- •Consulted with clients to assess data needs, delivering reporting solutions which reduced project timelines by 20%.
- •Implemented innovative data visualization strategies, leading to enhanced engagement and understanding by stakeholders.
- •Worked on various big data projects involving Hadoop, contributing to a significant 25% increase in data processing speed.
- •Evaluated business systems and recommended improvements, resulting in better data governance processes company-wide.
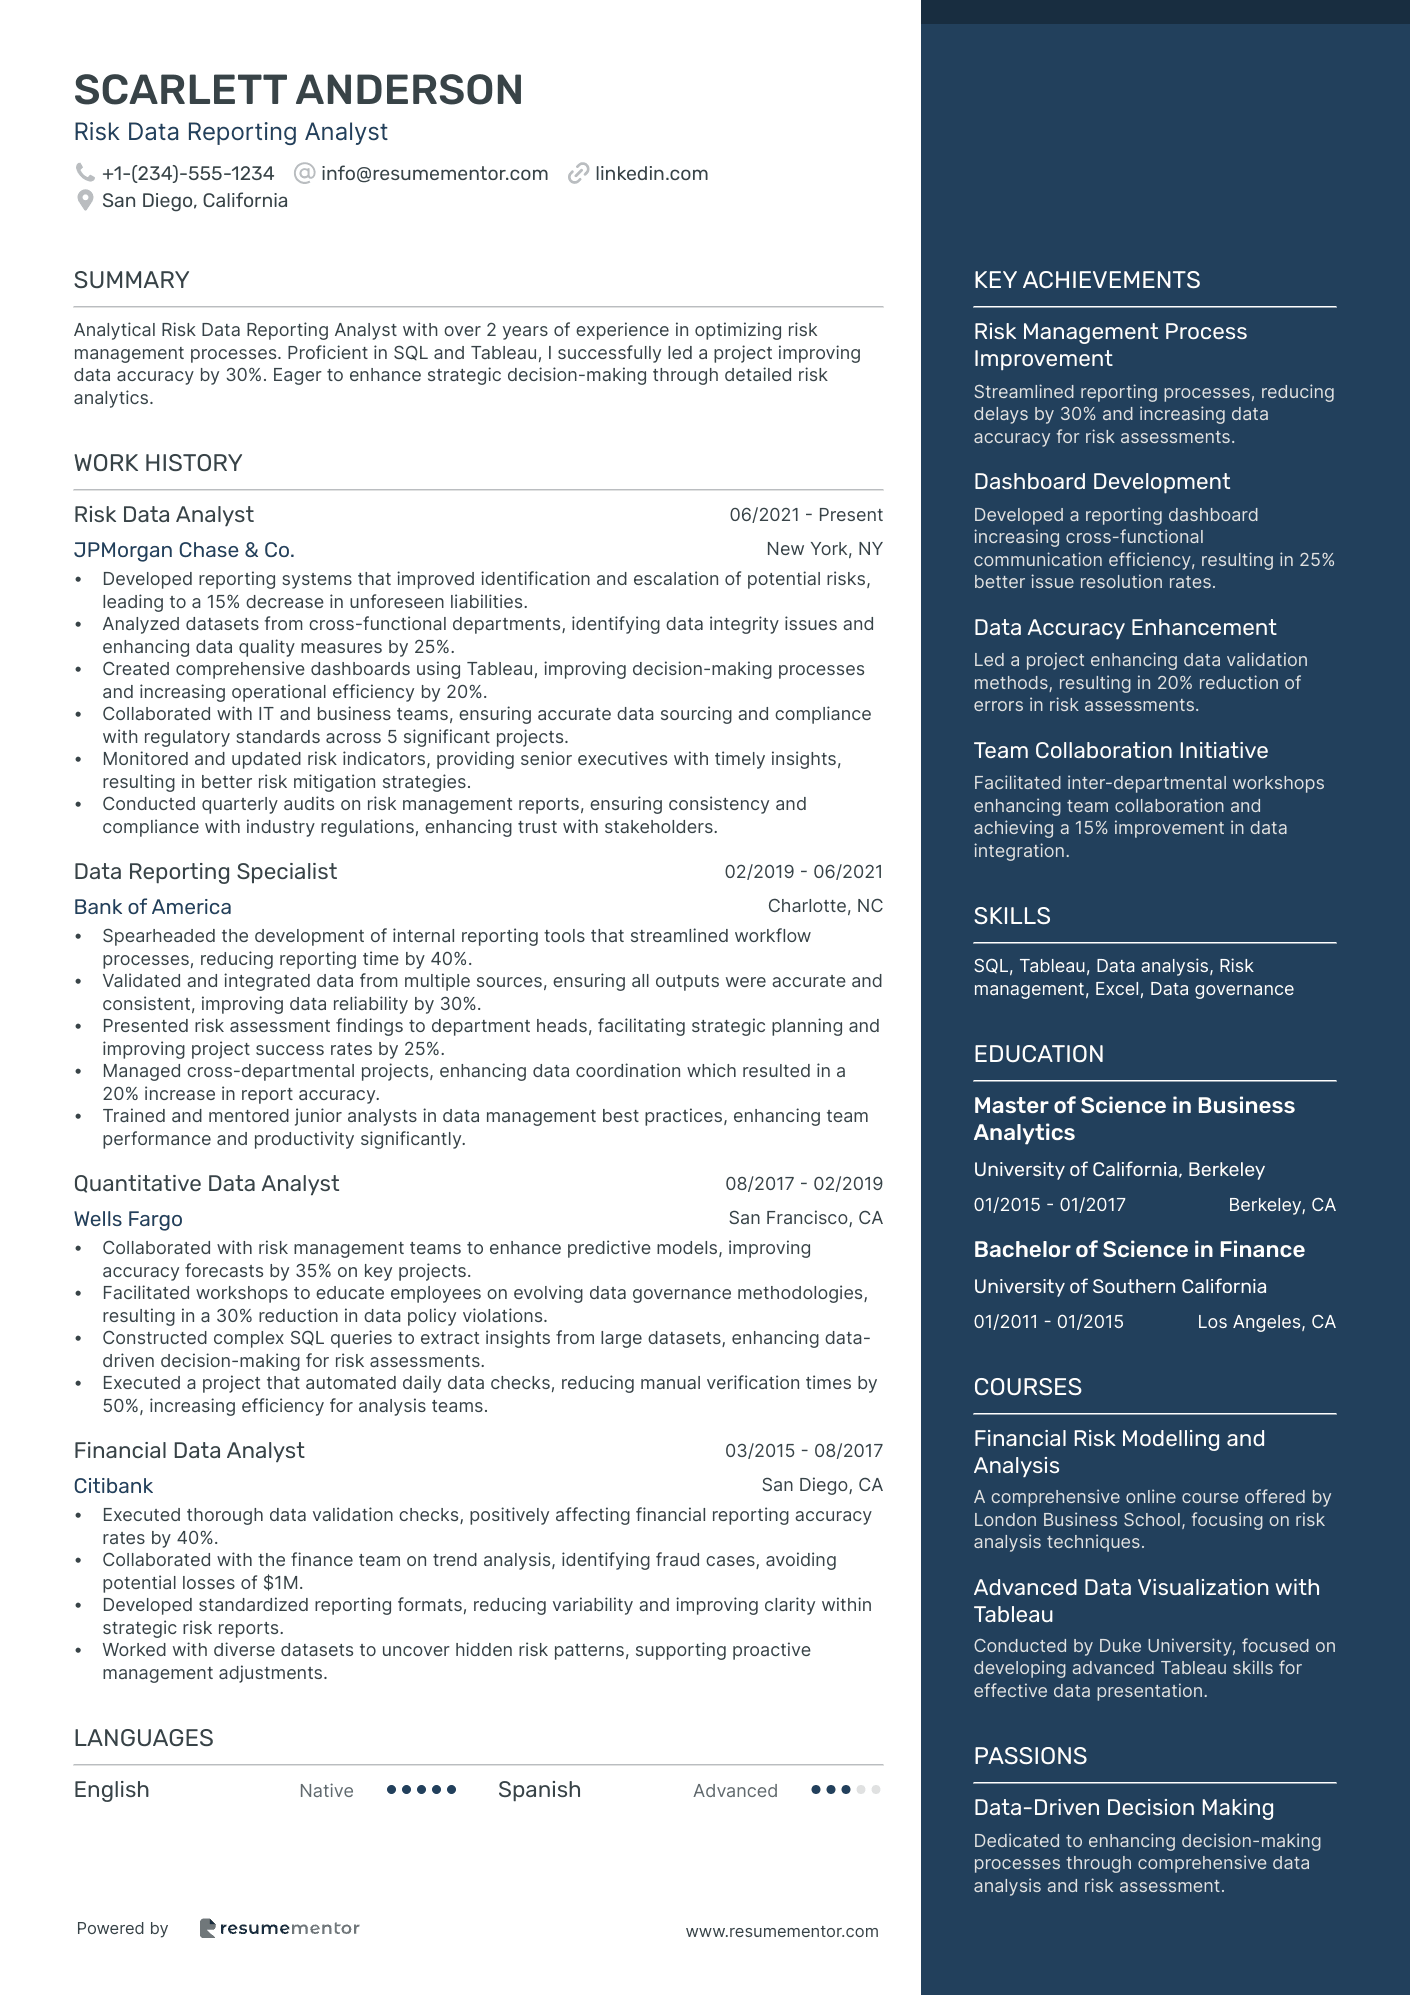
Risk Data Reporting Analyst resume sample
- •Developed reporting systems that improved identification and escalation of potential risks, leading to a 15% decrease in unforeseen liabilities.
- •Analyzed datasets from cross-functional departments, identifying data integrity issues and enhancing data quality measures by 25%.
- •Created comprehensive dashboards using Tableau, improving decision-making processes and increasing operational efficiency by 20%.
- •Collaborated with IT and business teams, ensuring accurate data sourcing and compliance with regulatory standards across 5 significant projects.
- •Monitored and updated risk indicators, providing senior executives with timely insights, resulting in better risk mitigation strategies.
- •Conducted quarterly audits on risk management reports, ensuring consistency and compliance with industry regulations, enhancing trust with stakeholders.
- •Spearheaded the development of internal reporting tools that streamlined workflow processes, reducing reporting time by 40%.
- •Validated and integrated data from multiple sources, ensuring all outputs were accurate and consistent, improving data reliability by 30%.
- •Presented risk assessment findings to department heads, facilitating strategic planning and improving project success rates by 25%.
- •Managed cross-departmental projects, enhancing data coordination which resulted in a 20% increase in report accuracy.
- •Trained and mentored junior analysts in data management best practices, enhancing team performance and productivity significantly.
- •Collaborated with risk management teams to enhance predictive models, improving accuracy forecasts by 35% on key projects.
- •Facilitated workshops to educate employees on evolving data governance methodologies, resulting in a 30% reduction in data policy violations.
- •Constructed complex SQL queries to extract insights from large datasets, enhancing data-driven decision-making for risk assessments.
- •Executed a project that automated daily data checks, reducing manual verification times by 50%, increasing efficiency for analysis teams.
- •Executed thorough data validation checks, positively affecting financial reporting accuracy rates by 40%.
- •Collaborated with the finance team on trend analysis, identifying fraud cases, avoiding potential losses of $1M.
- •Developed standardized reporting formats, reducing variability and improving clarity within strategic risk reports.
- •Worked with diverse datasets to uncover hidden risk patterns, supporting proactive management adjustments.
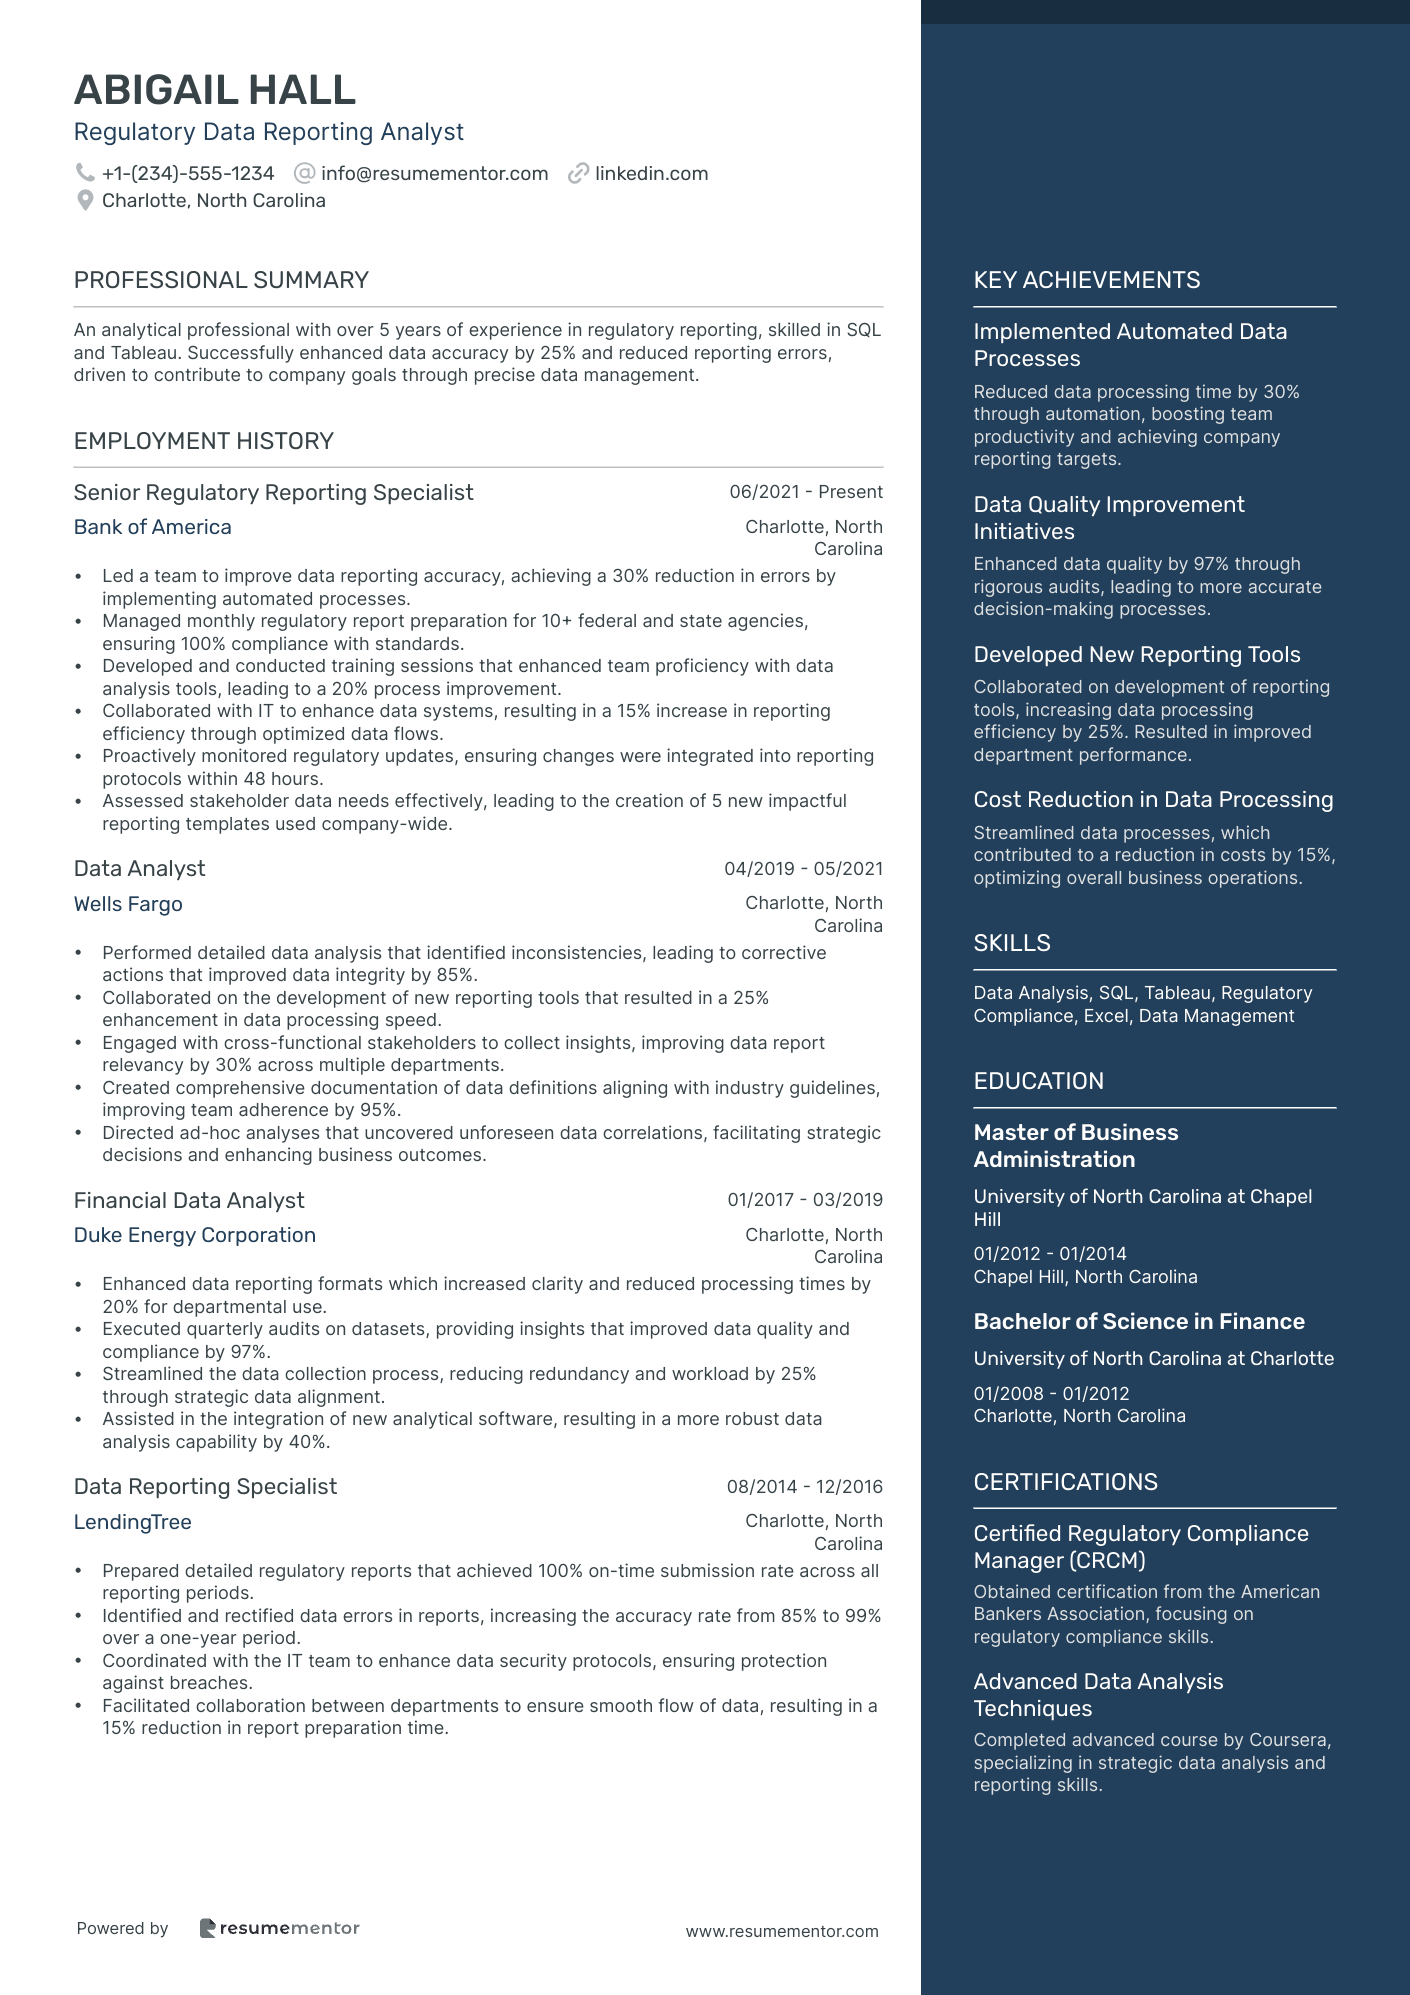
Regulatory Data Reporting Analyst resume sample
- •Led a team to improve data reporting accuracy, achieving a 30% reduction in errors by implementing automated processes.
- •Managed monthly regulatory report preparation for 10+ federal and state agencies, ensuring 100% compliance with standards.
- •Developed and conducted training sessions that enhanced team proficiency with data analysis tools, leading to a 20% process improvement.
- •Collaborated with IT to enhance data systems, resulting in a 15% increase in reporting efficiency through optimized data flows.
- •Proactively monitored regulatory updates, ensuring changes were integrated into reporting protocols within 48 hours.
- •Assessed stakeholder data needs effectively, leading to the creation of 5 new impactful reporting templates used company-wide.
- •Performed detailed data analysis that identified inconsistencies, leading to corrective actions that improved data integrity by 85%.
- •Collaborated on the development of new reporting tools that resulted in a 25% enhancement in data processing speed.
- •Engaged with cross-functional stakeholders to collect insights, improving data report relevancy by 30% across multiple departments.
- •Created comprehensive documentation of data definitions aligning with industry guidelines, improving team adherence by 95%.
- •Directed ad-hoc analyses that uncovered unforeseen data correlations, facilitating strategic decisions and enhancing business outcomes.
- •Enhanced data reporting formats which increased clarity and reduced processing times by 20% for departmental use.
- •Executed quarterly audits on datasets, providing insights that improved data quality and compliance by 97%.
- •Streamlined the data collection process, reducing redundancy and workload by 25% through strategic data alignment.
- •Assisted in the integration of new analytical software, resulting in a more robust data analysis capability by 40%.
- •Prepared detailed regulatory reports that achieved 100% on-time submission rate across all reporting periods.
- •Identified and rectified data errors in reports, increasing the accuracy rate from 85% to 99% over a one-year period.
- •Coordinated with the IT team to enhance data security protocols, ensuring protection against breaches.
- •Facilitated collaboration between departments to ensure smooth flow of data, resulting in a 15% reduction in report preparation time.
As a data reporting analyst, you're adept at navigating vast oceans of data to draw meaningful insights. However, when it comes to crafting your resume, you might feel like you're searching for direction. Translating technical expertise into a compelling narrative can be daunting. You need a resume that clearly communicates your analytical prowess and the impactful results you've achieved.
Finding the right balance between outlining your technical skills and telling your professional story is vital. Your expertise with tools like SQL, Excel, and data visualization software forms the backbone of your skills. Yet, it's equally important to highlight your ability to translate complex data findings into actionable insights for diverse audiences. This dual focus ensures your resume resonates with hiring managers who may not be familiar with technical jargon.
A structured resume template can guide you in organizing your information effectively. It provides a framework that keeps your resume visually appealing and ensures that your strengths are immediately evident to potential employers. Check out these resume templates to kickstart your process, helping your resume shine in today's competitive job market.
Remember, while your resume is a critical tool in your job search, it's part of a broader professional narrative. Craft it with care, detail, and clarity, setting a course toward promising new opportunities.
Key Takeaways
- A data reporting analyst resume should balance technical expertise with the ability to communicate insights clearly to both technical and non-technical audiences.
- Employ a structured resume template to present skills and experiences in a visually appealing and organized manner, enhancing the resume's appeal to potential employers.
- Use a reverse chronological format to highlight recent accomplishments and preferred tools, aligning with industry expectations for showcasing real, current skills and results.
- Detail achievements quantitatively in the experience section, using clear metrics and action verbs to illustrate contributions and align them with the job you're applying for.
- Include sections for relevant education, certifications, and possibly extras like languages, hobbies, or volunteer work to paint a comprehensive picture of professional and personal qualities.
What to focus on when writing your data reporting analyst resume
A data reporting analyst resume should clearly convey your ability to analyze data, pay close attention to detail, and effectively use data visualization tools. This showcases your skill in turning complex data into actionable insights that support smart business decisions.
How to structure your data reporting analyst resume
- Contact Information: Start with your name, phone number, email, and LinkedIn profile, ensuring each detail is up-to-date and presents a professional image—Establishes the foundation of your resume, making it easy for recruiters to reach out, which we will explore more in-depth in the sections below.
- Professional Summary: Focus on your data analysis and reporting talents, highlighting your experience with essential tools like Excel, Tableau, or SQL—Emphasize your capacity to handle large sets of data and make recommendations, which will be detailed more under skills and experience.
- Skills: Clearly list your data-related skills, emphasizing expertise in statistical analysis, data visualization, and knowledge of programming languages such as Python or R—Show how these skills contribute to the company's data objectives, a point we'll illuminate further in subsequent sections.
- Work Experience: Provide a detailed account of your job roles and responsibilities, using specific examples of projects where you enhanced data accuracy or efficiency—Reference any work with business intelligence platforms to highlight your practical experience, and we'll explain this area deeper as we discuss each section individually.
- Education: Share your educational background, focusing on degrees related to data analysis or statistics. Highlight any certifications in data analytics, such as a Tableau certification—Illustrate your commitment to learning, which sets the stage for our detailed look into how these qualifications make you a great fit for the role.
- Technical Competencies: Explain your experience with analytical software and platforms, detailing how you manage large datasets and automate reporting processes—Demonstrate your technical expertise and problem-solving skills, which we'll detail further as we dissect each aspect of your resume.
Which resume format to choose
Your data reporting analyst resume should use a reverse chronological format, which is most effective in highlighting your recent accomplishments and skills. In data analysis, employers are often interested in your latest projects and tools you're proficient with, so this format aligns perfectly with industry expectations.
When it comes to fonts, your choice can subtly impact how your resume is perceived. Opt for modern fonts like Raleway, Lato, or Montserrat, which convey a sense of professionalism and align well with the tech-forward impression of a data reporting analyst. These fonts ensure clarity and ease of reading, which is crucial when presenting complex information succinctly.
Saving your resume as a PDF is crucial, as it preserves your formatting integrity across all platforms and devices. This reliability is important because you want hiring managers to see your resume exactly as you've designed it, ensuring none of your carefully curated details are lost or misaligned.
Maintaining one-inch margins not only provides neatness but also ensures that your content is well-spaced and easy to digest. Adequate spacing allows your key points and achievements to stand out without overwhelming the reader, making your resume more engaging and easier to navigate.
How to write a quantifiable resume experience section
To craft an outstanding data reporting analyst resume experience section, focus on showcasing your achievements and aligning them with the job you're applying for. Highlight your skills and the real impact you've made by using clear data and metrics. This section is your career narrative, illustrating how you've added value at previous jobs and what you can bring to a new employer. Begin with your most recent job and work backward, including roles from the last 10-15 years or those most relevant to the data reporting analyst position. It's essential to weave in keywords from the job ad to enhance your appeal. Use dynamic action verbs like "analyzed," "developed," "optimized," and "improved" to vividly describe your successes.
Here's an effective data reporting analyst experience example:
03/2018 - 08/2023 - •Developed and automated reporting processes, cutting report generation time by 30%.
- •Teamed up with cross-functional groups to boost data accuracy by 25%.
- •Dug deep into sales data to spot trends, leading to a 15% bump in revenue.
- •Led training on data tools, improving team efficiency by 20%.
This experience section is impactful because it seamlessly presents your achievements with accurate metrics, painting a clear picture of your contributions. Each bullet point logically connects to enhancements you've driven, reinforcing your role as a data reporting analyst. By focusing on relevant skills and tailored moments, you ensure prospective employers see your potential fit. Featuring specific outcomes and value-added tasks allows your resume to capture attention, effectively setting you apart from other candidates.
Collaboration-Focused resume experience section
A collaboration-focused Data Reporting Analyst resume experience section should illustrate your ability to work effectively with others to achieve common goals. Start by highlighting instances where you teamed up with different departments or teams, showcasing your communication skills and joint successes. Use simple language to keep your examples accessible, making it easy for potential employers to grasp the impact of your teamwork on process improvements and objective achievements.
Present your experience by stating your job title, workplace, and the dates of employment. In the bullet points, describe your role and how you contributed to collaborative projects. Highlight your analytical skills and your knack for working well with others. Share specific examples of how your collaboration led to tangible improvements, like enhanced data accuracy or quicker report generation, making sure that your shared efforts clearly stand out.
Data Reporting Analyst
Data Analytics Co.
June 2020 - Present
- Worked with the sales team to create a dashboard that tracks daily sales, improving response time to market changes.
- Teamed up with IT to implement a new data warehouse system, cutting report generation time by 30%.
- Joined forces with marketing to analyze campaign performance, resulting in a 15% boost in lead conversions.
- Collaborated with product management to refine data metrics, aligning them with business goals for sharper strategic insights.
Skills-Focused resume experience section
A skills-focused data reporting analyst resume experience section should emphasize your ability to transform data into actionable insights. Start by showing how your analytical skills have driven success in past roles, particularly in data analysis, visualization, and report generation. Use specific examples to illustrate your contributions to team achievements and company improvements. By incorporating dynamic action verbs, you can clearly highlight the impact of your efforts and the enhancements you made to processes and outcomes.
Focusing on tangible results is key when detailing your experiences. Demonstrate how you used data insights to make informed decisions and improve efficiency. Highlight any tools or software you mastered and the measurable impact of your work. Keep each sentence concise while ensuring that every entry highlights a specific skill or accomplishment in data reporting.
Data Reporting Analyst
Tech Solutions Inc.
2018-2021
- Led detailed data analysis to spot trends, boosting quarterly sales predictions by 15%.
- Created interactive dashboards with Tableau and Power BI, improving data visibility for all teams.
- Teamed up with the IT staff to automate data collection, cutting retrieval time by 30%.
- Produced in-depth reports that streamlined decision-making, hiking productivity by 20%.
Growth-Focused resume experience section
A growth-focused data reporting analyst resume experience section should clearly demonstrate how your skills and contributions have driven company improvements. Begin by showcasing instances where your ability to analyze and interpret data has directly led to company success. Using bullet points, outline these achievements in a way that allows potential employers to quickly grasp your impact. Active language will help illustrate your role in advancing strategic goals and achieving measurable outcomes.
Focus first on key projects or responsibilities where your work noticeably boosted the company’s growth. Whenever possible, include quantifiable results to provide solid evidence of your contributions. Consider how your expertise in data analysis and reporting enhanced operational efficiency or revenue. This section should weave a narrative of how your efforts supported the company's objectives, persuading employers that you can replicate this success within their organization.
Data Reporting Analyst
Tech Innovators Inc.
June 2021 - September 2023
- Analyzed customer data to pinpoint a 15% surge in product demand, which optimized inventory management.
- Streamlined reporting processes, effectively cutting report generation time by 40% and freeing teams to focus on strategy.
- Created a predictive analytics model for accurate sales trend forecasting, resulting in a 20% boost in sales strategies.
- Collaborated with cross-functional teams to enhance data visualization tools, elevating user engagement by 25%.
Problem-Solving Focused resume experience section
A problem-solving-focused data reporting analyst resume experience section should clearly showcase your ability to identify and address data challenges. Begin by highlighting roles where you effectively analyzed data and devised impactful solutions. Detail the techniques you used, such as statistical analysis or data visualization, while emphasizing how these approaches led to meaningful improvements at your workplace. This creates a cohesive story about your problem-solving achievements, such as enhancing report accuracy or optimizing data processing efficiency, effectively demonstrating your expertise.
For each bullet point, use straightforward language to connect the challenges you faced with the solutions you implemented. This approach crafts a narrative that illustrates how you leveraged data insights to influence strategic business decisions. For instance, discuss how you uncovered data inconsistencies, which led to adjustments in analytical models and improved report reliability. This highlights the tangible value you brought to your organization, such as increased productivity, cost savings, or improved customer satisfaction, effectively linking each point with a clear purpose and outcome.
Data Reporting Analyst
Tech Innovations Co.
Jan 2020 - Present
- Identified and resolved data discrepancies, improving report accuracy by 30%.
- Developed a new data visualization dashboard that reduced report generation time by 25%.
- Collaborated with IT and business teams to integrate a new reporting tool, streamlining data processes.
- Analyzed historical data to predict trends, enhancing strategic planning decision-making.
Write your data reporting analyst resume summary section
A results-focused data reporting analyst resume summary should effectively demonstrate your expertise and achievements. Start by mentioning your years of experience in key areas like data analysis, reporting, and data visualization tools. Use strong action verbs to convey your impact in previous roles and specific accomplishments that showcase your ability to make data-driven decisions. Consider this example:
This exemplary summary ties together your technical skills, achievements, and leadership qualities in a cohesive manner. It highlights your fit for the job and effectively sets the tone for the rest of your resume. While a resume summary focuses on accomplishments and skills, a resume objective is more about your career aspirations, often used by those with less experience. Alternatively, a resume profile offers a broader overview of your career, skills, and goals, while a summary of qualifications quickly lists skills to grab attention. Selecting the right format is key to underscoring your unique strengths and aligning with your experience level, ensuring your resume starts strong and engages potential employers.
Listing your data reporting analyst skills on your resume
A skills-focused data reporting analyst resume should effectively highlight your abilities to make an impact. Start by understanding that your skills can be showcased in a dedicated section or integrated into your experience and summary areas. Highlighting your strengths and soft skills, such as communication and leadership, can complement your technical expertise. These personal qualities showcase who you are beyond just your technical abilities. At the same time, your hard skills, like programming or data analysis techniques, are specific abilities that demonstrate your technical competence.
Incorporating skills and strengths across your resume not only grabs a recruiter's attention but also helps your application pass through applicant tracking systems, as these often rely on keyword matches. To effectively present your skills in a standalone section, consider a clear format like JSON:
This format makes your skills section concise yet comprehensive, displaying crucial capabilities for a data reporting analyst. Skills such as SQL, Data Visualization, and Microsoft Excel highlight your technical expertise, while critical thinking and problem-solving abilities emphasize your analytical mindset. Mentioning tools like Tableau and languages like Python deepens your portfolio.
Best hard skills to feature on your data reporting analyst resume
For data reporting analysts, hard skills are essential as they reflect your technical proficiency and problem-solving abilities. These skills prove you can handle complex data tasks with ease. Here are 15 highly sought-after hard skills:
Hard Skills
- SQL
- Microsoft Excel
- Data Visualization
- Tableau
- Python
- Power BI
- R Programming
- Data Warehousing
- Statistical Analysis
- ETL Processes
- Business Intelligence
- Machine Learning
- Database Management
- SAS
- Hadoop
Best soft skills to feature on your data reporting analyst resume
Soft skills highlight your collaborative nature and ability to communicate data insights effectively. They show you can work well within a team and adapt to different situations. Here are 15 vital soft skills for data reporting analysts:
Soft Skills
- Communication
- Problem-Solving
- Critical Thinking
- Attention to Detail
- Time Management
- Teamwork
- Adaptability
- Creativity
- Leadership
- Conflict Resolution
- Collaboration
- Emotional Intelligence
- Strategic Thinking
- Decision Making
- Resilience
How to include your education on your resume
The education section of your resume is a crucial component when applying for a data reporting analyst position. It provides employers with insights into your academic background and qualifications, demonstrating your preparedness for the role. Tailor this section to each job application by only including relevant education. Excluding unrelated educational experiences can help maintain the resume's focus and clarity.
If listing your GPA, include it only if it's strong (3.5 or above) and relevant to the job. When you've graduated with honors like cum laude, include that alongside your degree to highlight your academic achievements. Present your degree by listing your major, the institution's name, and graduation dates. This clarity helps employers quickly assess your credentials.
Incorporate these tips for a well-structured education section:
09/2011 - 05/2013 This section does not align with a data reporting analyst career and lacks relevance.
09/2015 - 05/2019 This example effectively demonstrates relevant academic experience. Key details like a high GPA and a degree in data analytics align perfectly with the role's requirements. This clear presentation makes it easy for employers to see the value you bring to the position.
How to include data reporting analyst certificates on your resume
A certificates section is a crucial part of a data reporting analyst's resume. Including certificates shows your dedication to continuous learning and adds credibility to your skill set. To create a strong certificates section, list the name of each certificate clearly. Include the date you earned it to demonstrate its relevance. Add the name of the issuing organization to provide context and authenticity.
Certificates can also be included in the header of your resume. For example:
John Doe, Certified Data Analyst (Google), Tableau Certified Associate (Tableau)
In a standalone certificates section, you could format it like this:
This example is strong because it lists certifications relevant to data reporting analysts, such as the Certified Data Analyst from Google and the Tableau Certified Associate. These certificates highlight skills in data analysis and visualization, which are essential for the job. The example is also clear and easy to read, making it straightforward for hiring managers to verify your qualifications.
Extra sections to include in your data reporting analyst resume
Building a compelling resume is crucial for a data reporting analyst, as it showcases your skills, experiences, and unique personal qualities. When creating your resume, you need to include sections that highlight various aspects of your professional and personal life.
Language section — List the languages you speak fluently or proficiently. Demonstrate your ability to communicate with diverse teams and audiences.
Hobbies and interests section — Share hobbies that reflect analytical and technical skills relevant to your career. Convey a well-rounded personality and potential for cultural fit within a company.
Volunteer work section — Detail volunteer experiences that strengthened your analytical or leadership skills. Show dedication to social responsibility and the development of real-world skills.
Books section — Include books you've read that are relevant to data analysis or your professional development. Show your commitment to continuous learning and staying updated with industry trends.
In Conclusion
In conclusion, crafting an effective resume as a data reporting analyst is an essential step in showcasing your unique skill set and professional experiences. Your resume should not just highlight your technical skills, such as proficiency in SQL, Excel, and data visualization tools, but also your ability to translate complex data into actionable insights. Organizing your resume with a structured format and a clear professional summary helps potential employers quickly understand your strengths. Additionally, incorporating specific examples of your past achievements using metrics and clear outcomes can make your resume stand out in a competitive job market. A balance between emphasizing hard skills like statistical analysis and soft skills such as communication and collaboration will further illustrate your comprehensive capabilities. Remember to tailor your resume to each job application by highlighting the most relevant experiences and qualifications. Including sections on education, certifications, and other personal attributes ensures that your resume presents a well-rounded picture of who you are as a professional. Finally, maintain the integrity of your resume's design by saving it as a PDF to ensure it appears flawlessly across different platforms. Collectively, these elements not only confirm your expertise but also align with industry standards, setting you on a pathway to new career opportunities.
Related Articles

Continue Reading
Check more recommended readings to get the job of your dreams.
Resume
Resources
Tools
© 2026. All rights reserved.
Made with love by people who care.