Power BI Developer Resume Examples

Aug 27, 2024
|
12 min read
"Create a power-packed Power BI developer resume: Tips and tricks to help you visualize your career path and land that dream job"
Rated by 348 people
- •Designed and deployed BI application user functionality using Microsoft SQL Server BI technology stack, enhancing reporting capabilities by 40%.
- •Led ETL process design and execution, ensuring data accuracy and improving data accessibility by 30%.
- •Collaborated with business leaders to identify key requirements, leading to a 25% improvement in business intelligence strategies.
- •Conducted operational monitoring and troubleshooting, reducing downtime by 15%.
- •Defined and enforced architecture standards, improving coding quality and team efficiency by 20%.
- •Worked with third-party vendors to deliver BI applications, resulting in seamless integration and a 10% increase in user satisfaction.
- •Implemented enterprise BI and performance management solutions, achieving a 35% increase in data-driven decision-making.
- •Devised data integration strategies using SSIS, SSRS, and SSAS, enhancing data flow by 25%.
- •Documented requirement specifications and designed ETL and reporting solutions, streamlining processes by 30%.
- •Coordinated with technology leaders to integrate BI solutions, boosting system efficiency by 20%.
- •Provided technical direction and collaborated across functions, exceeding business objectives by 15%.
- •Developed and executed ETL processes, resulting in a 20% increase in data reliability.
- •Designed dimensional data models and data architecture, improving reporting accuracy by 25%.
- •Conducted project planning and work estimates, successfully reducing project timelines by 10%.
- •Maintained and monitored SQL Server BI platform, reducing system errors by 15%.
- •Analyzed complex financial data to provide actionable insights, increasing financial efficiency by 20%.
- •Developed data sourcing and mapping strategies, enhancing data integration processes by 18%.
- •Conducted data flow management within implemented solutions, boosting data accuracy by 15%.
- •Worked cooperatively with cross-functional teams to meet and exceed business objectives.

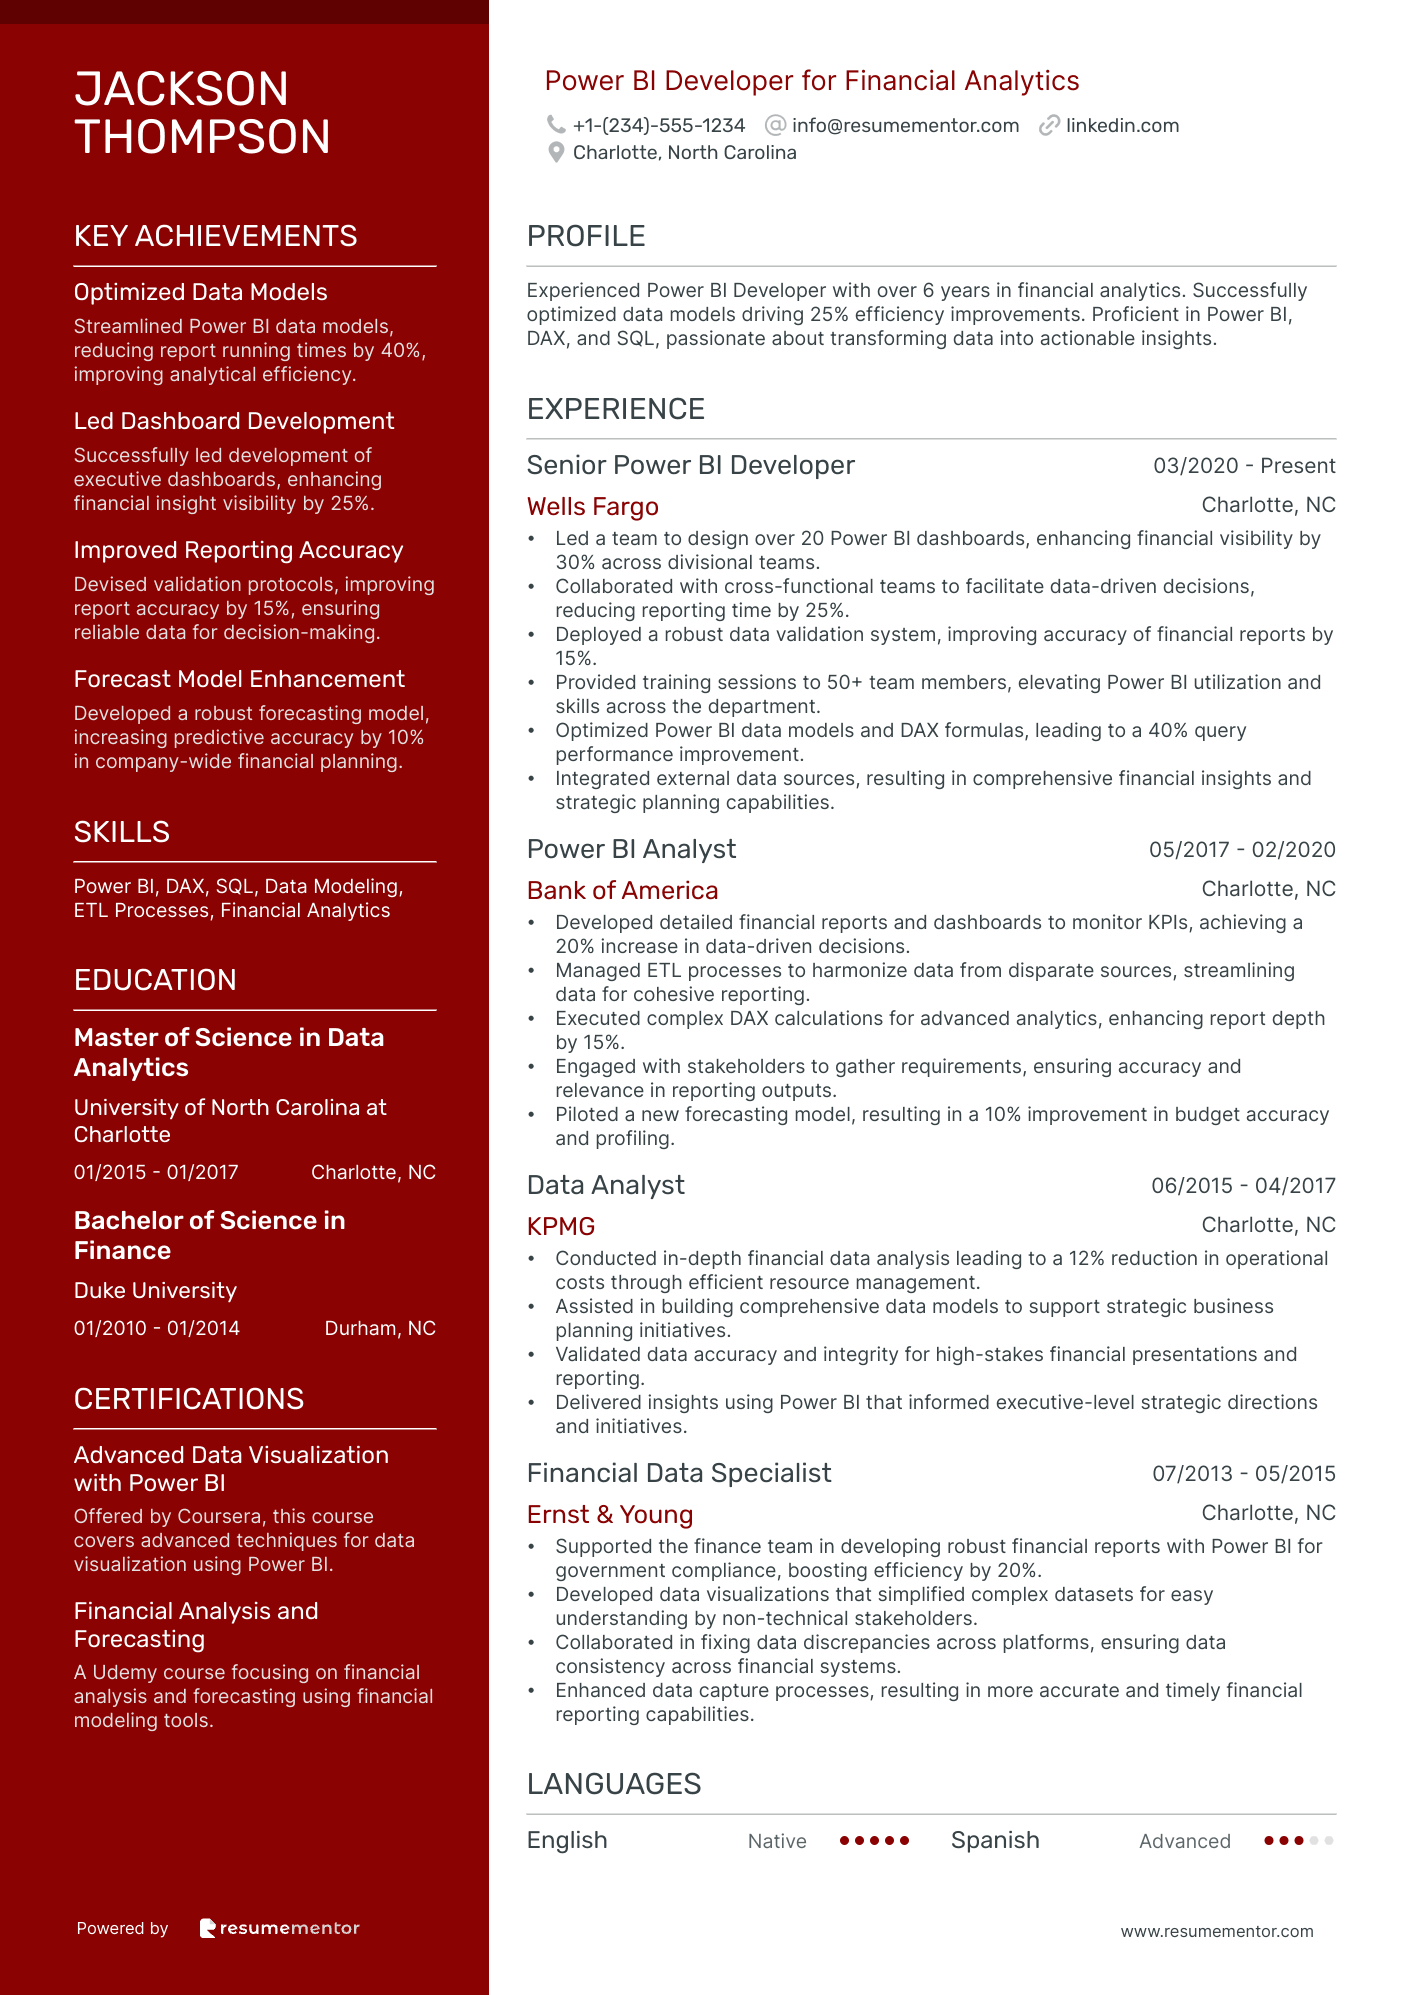
Power BI Developer for Financial Analytics
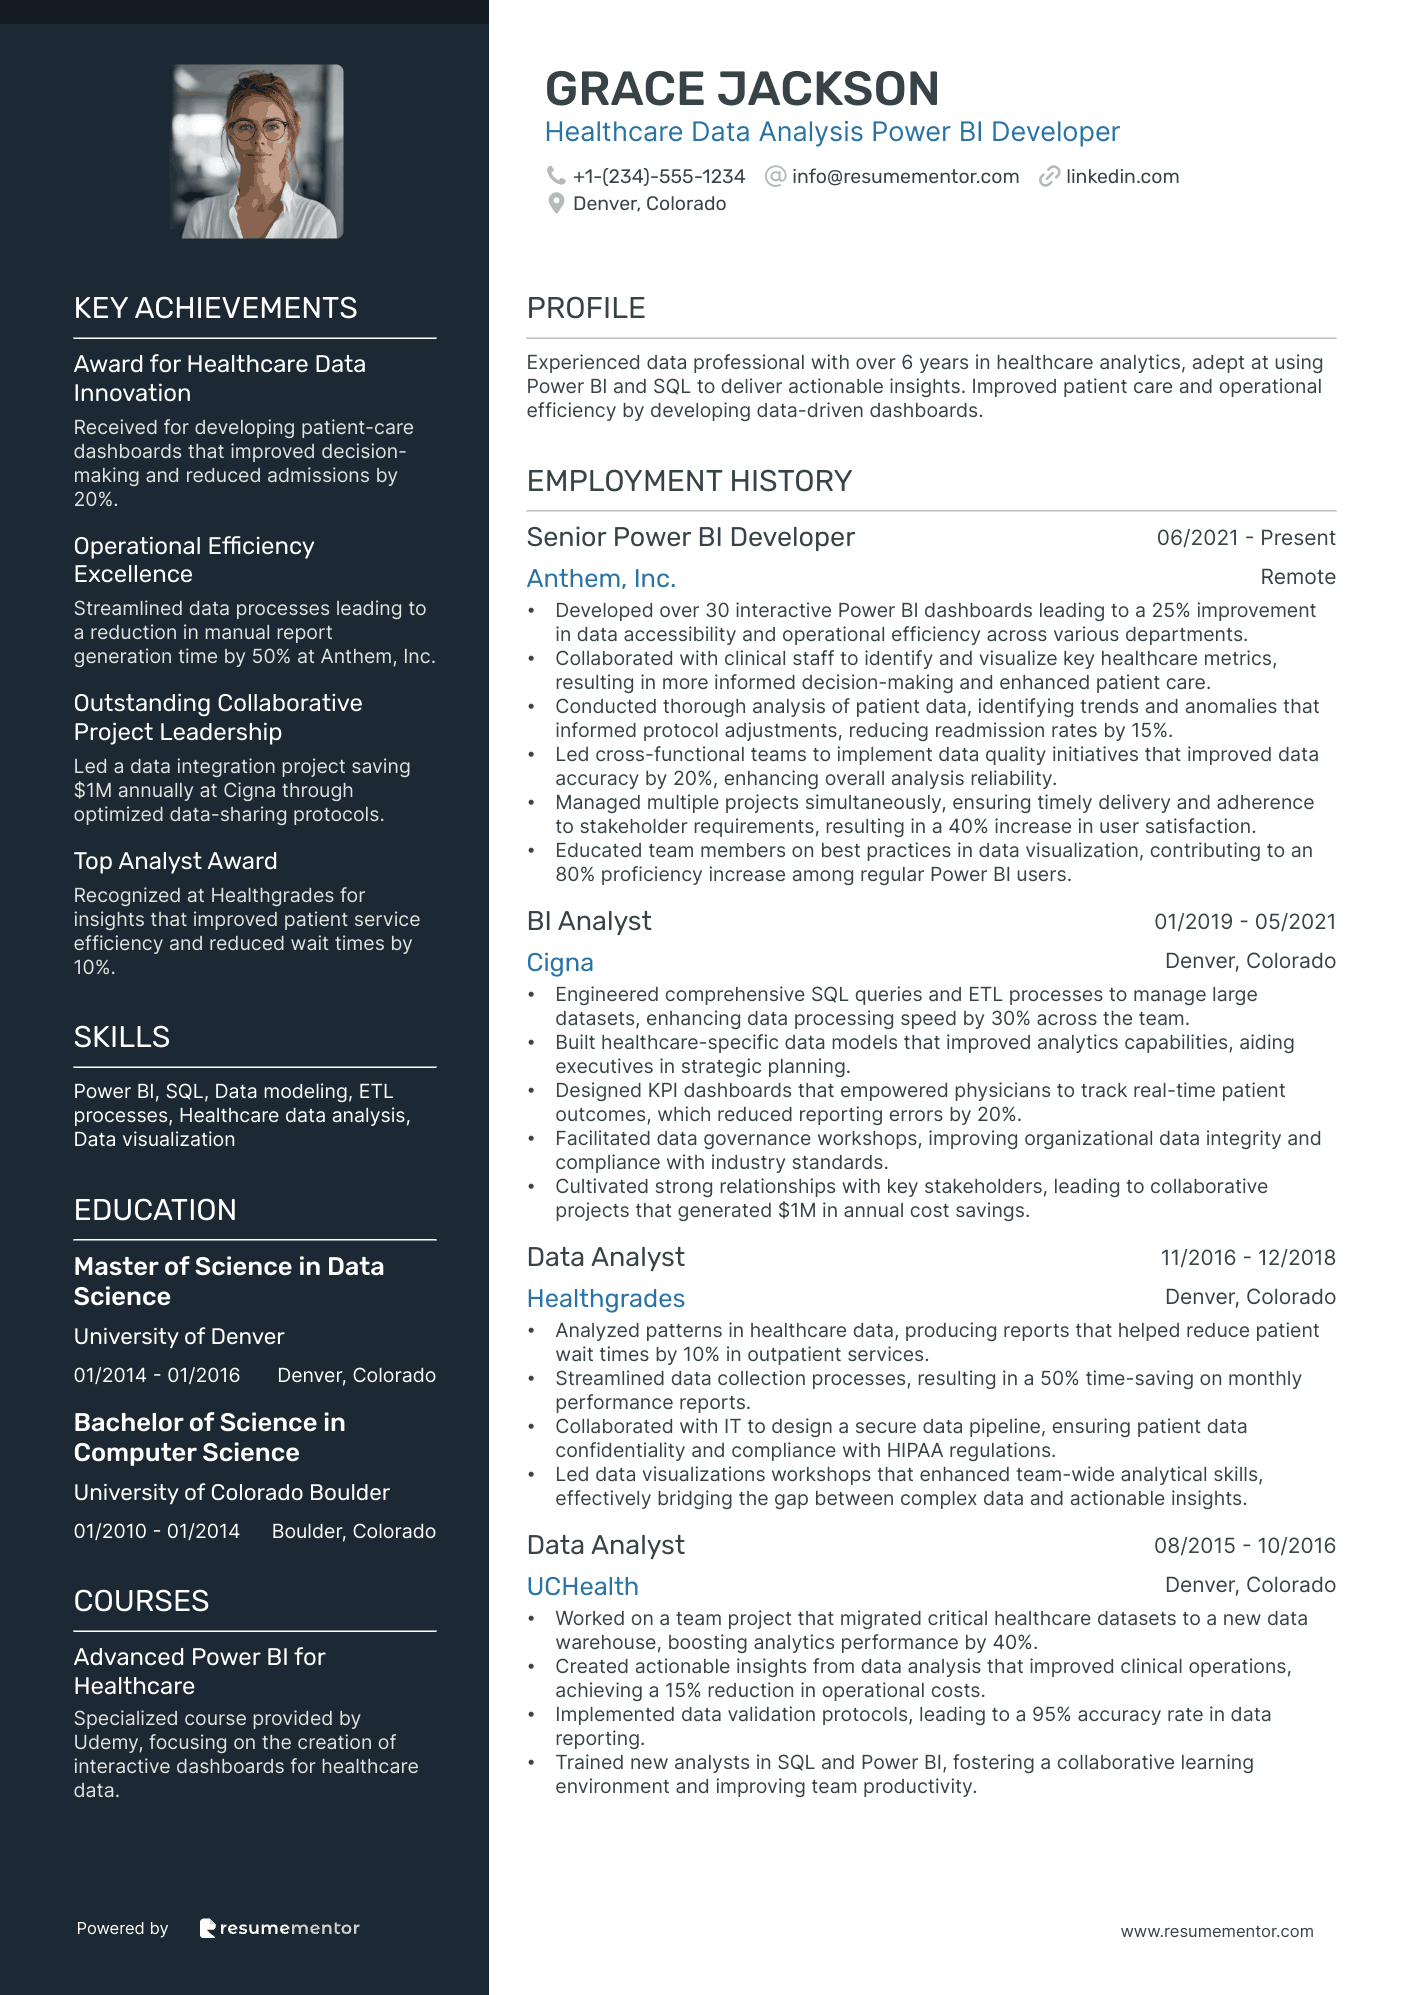
Healthcare Data Analysis Power BI Developer
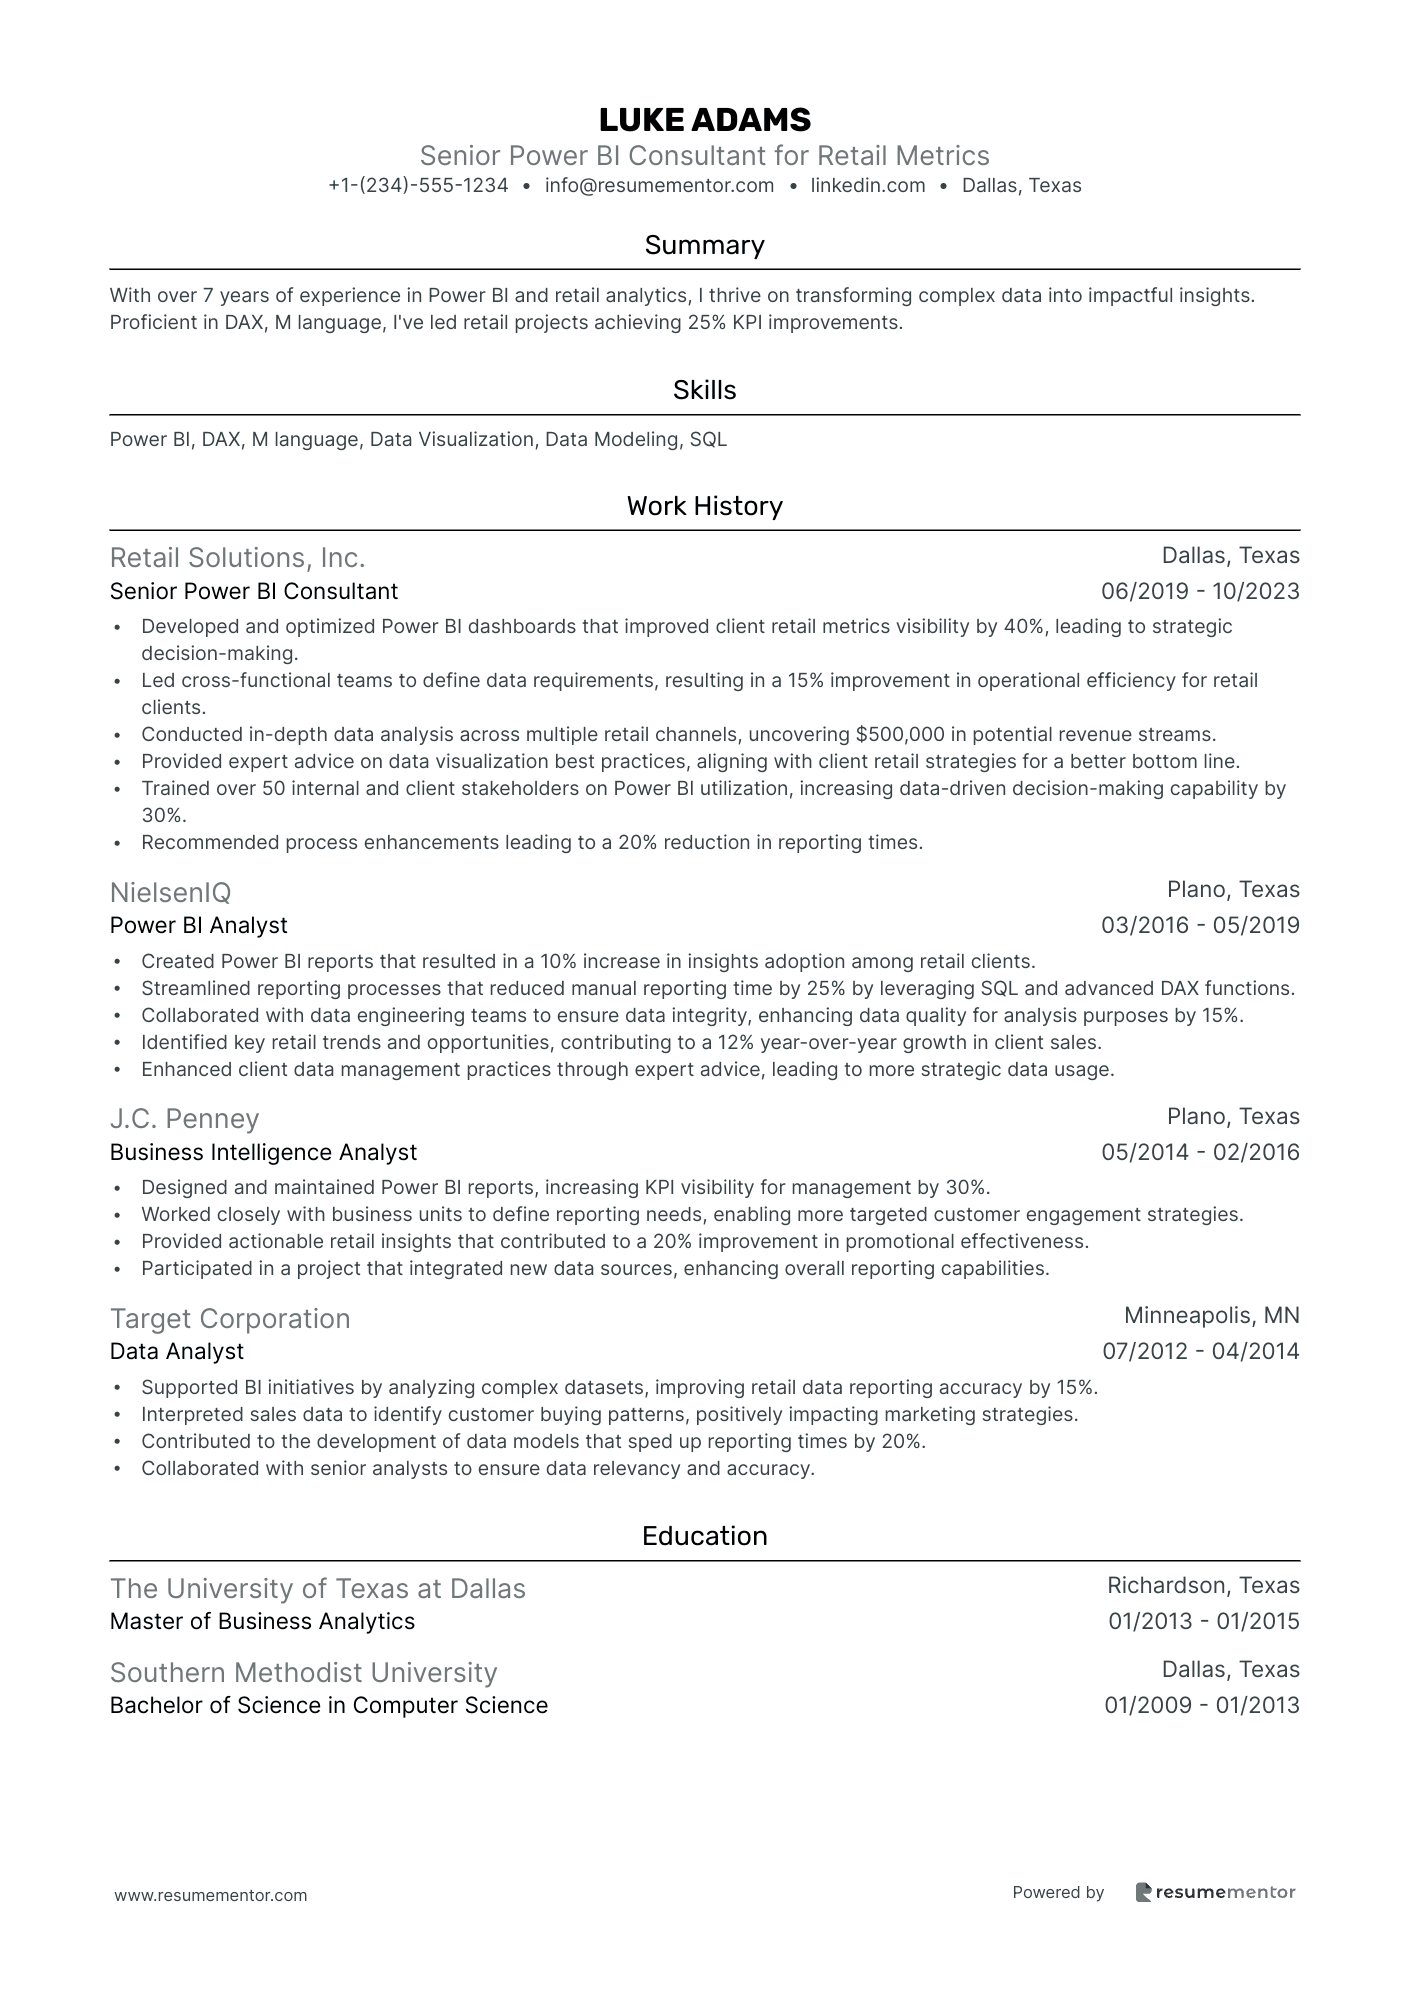
Senior Power BI Consultant for Retail Metrics
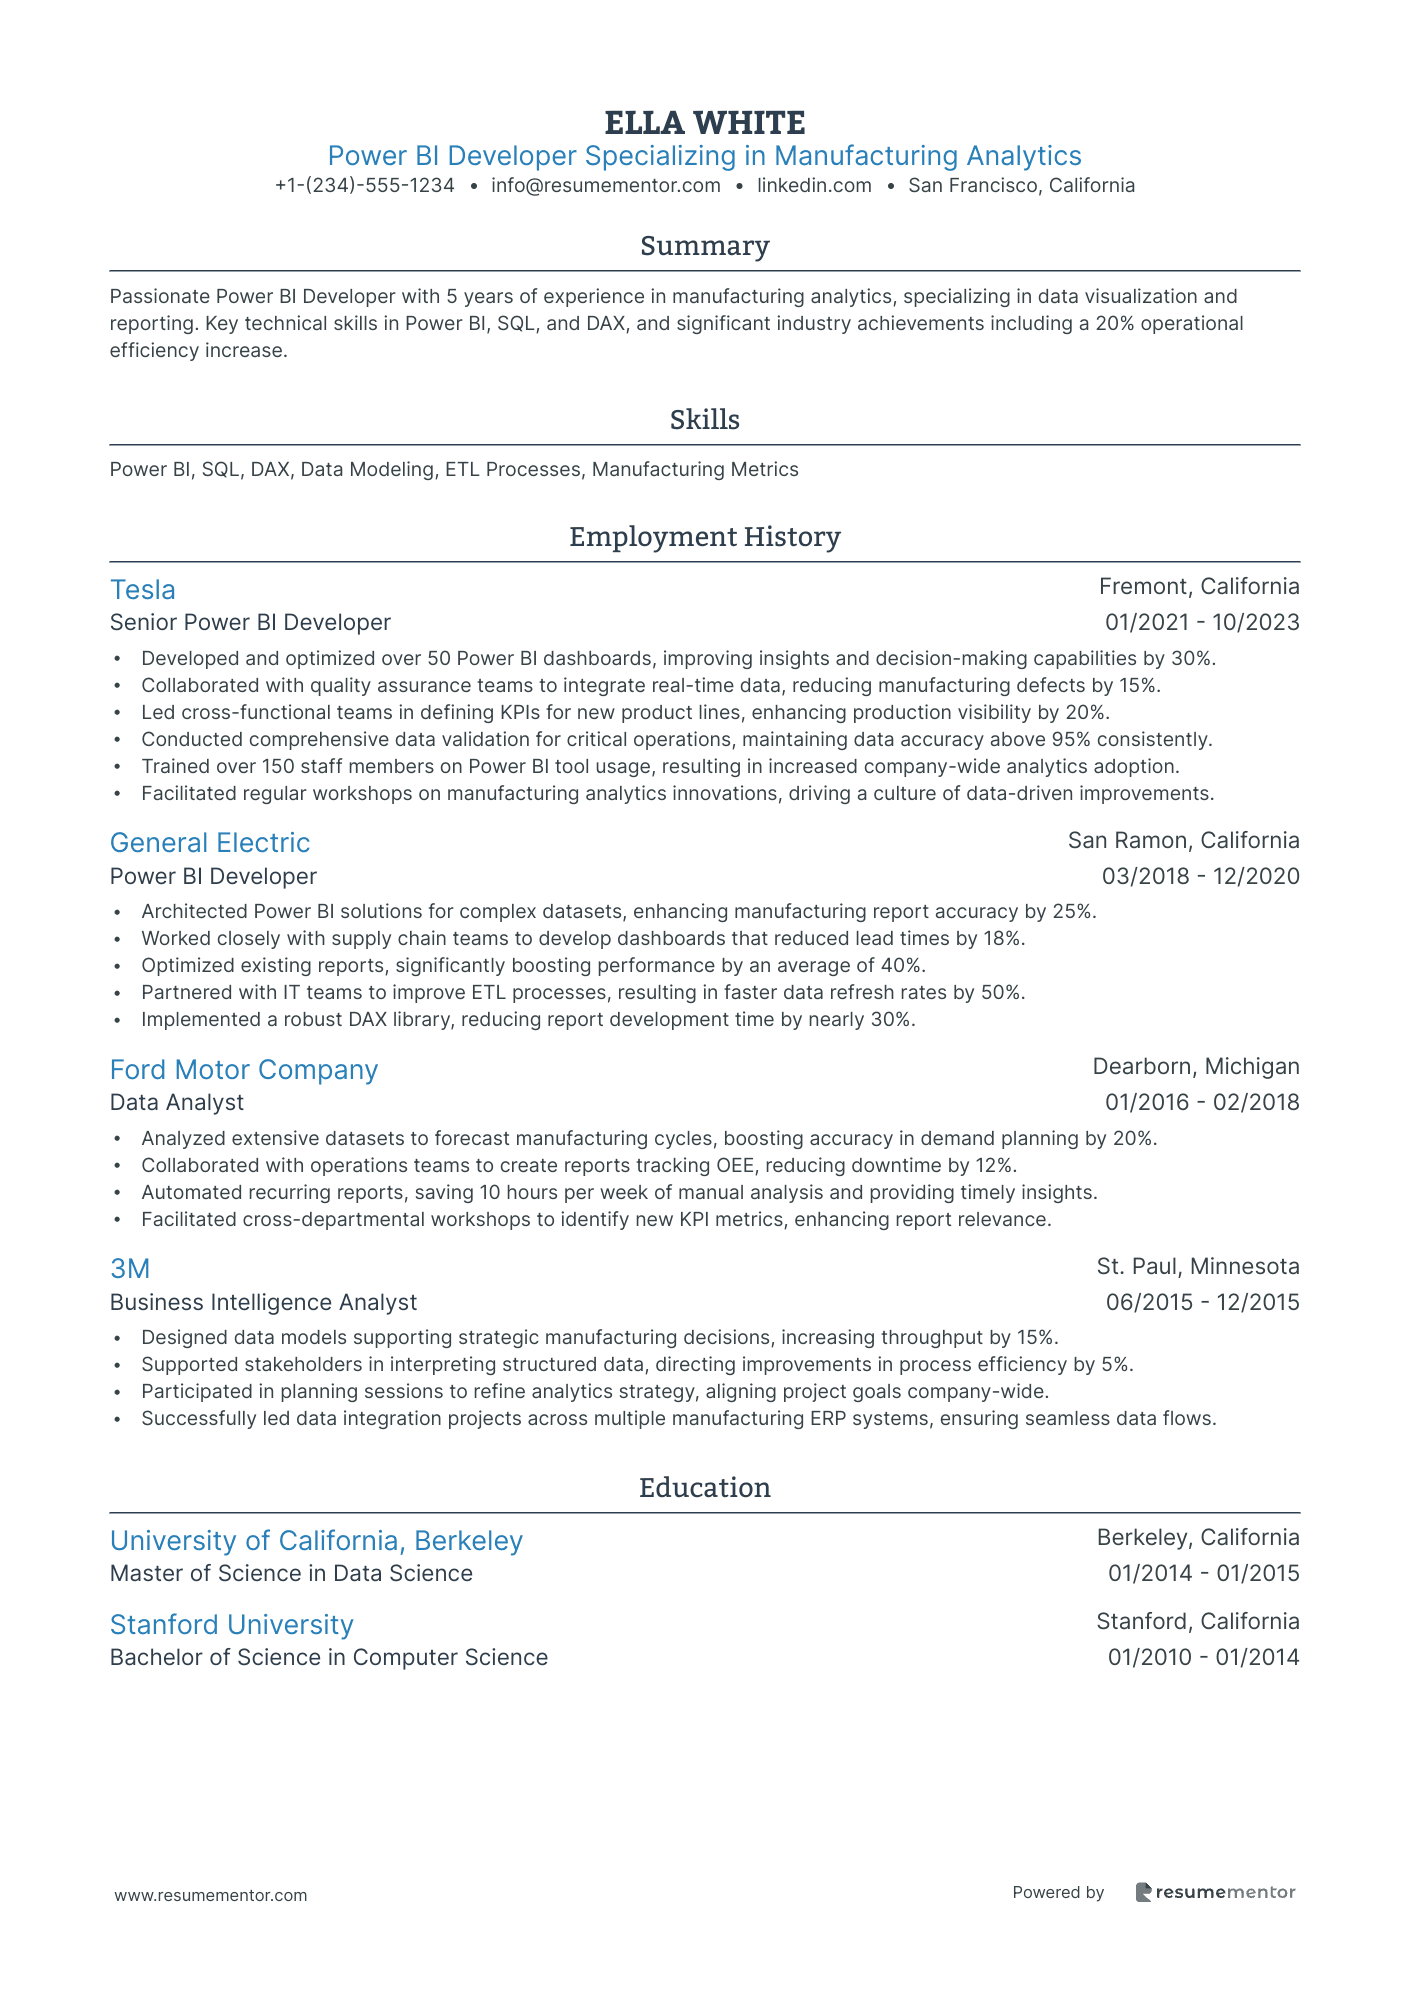
Power BI Developer Specializing in Manufacturing Analytics
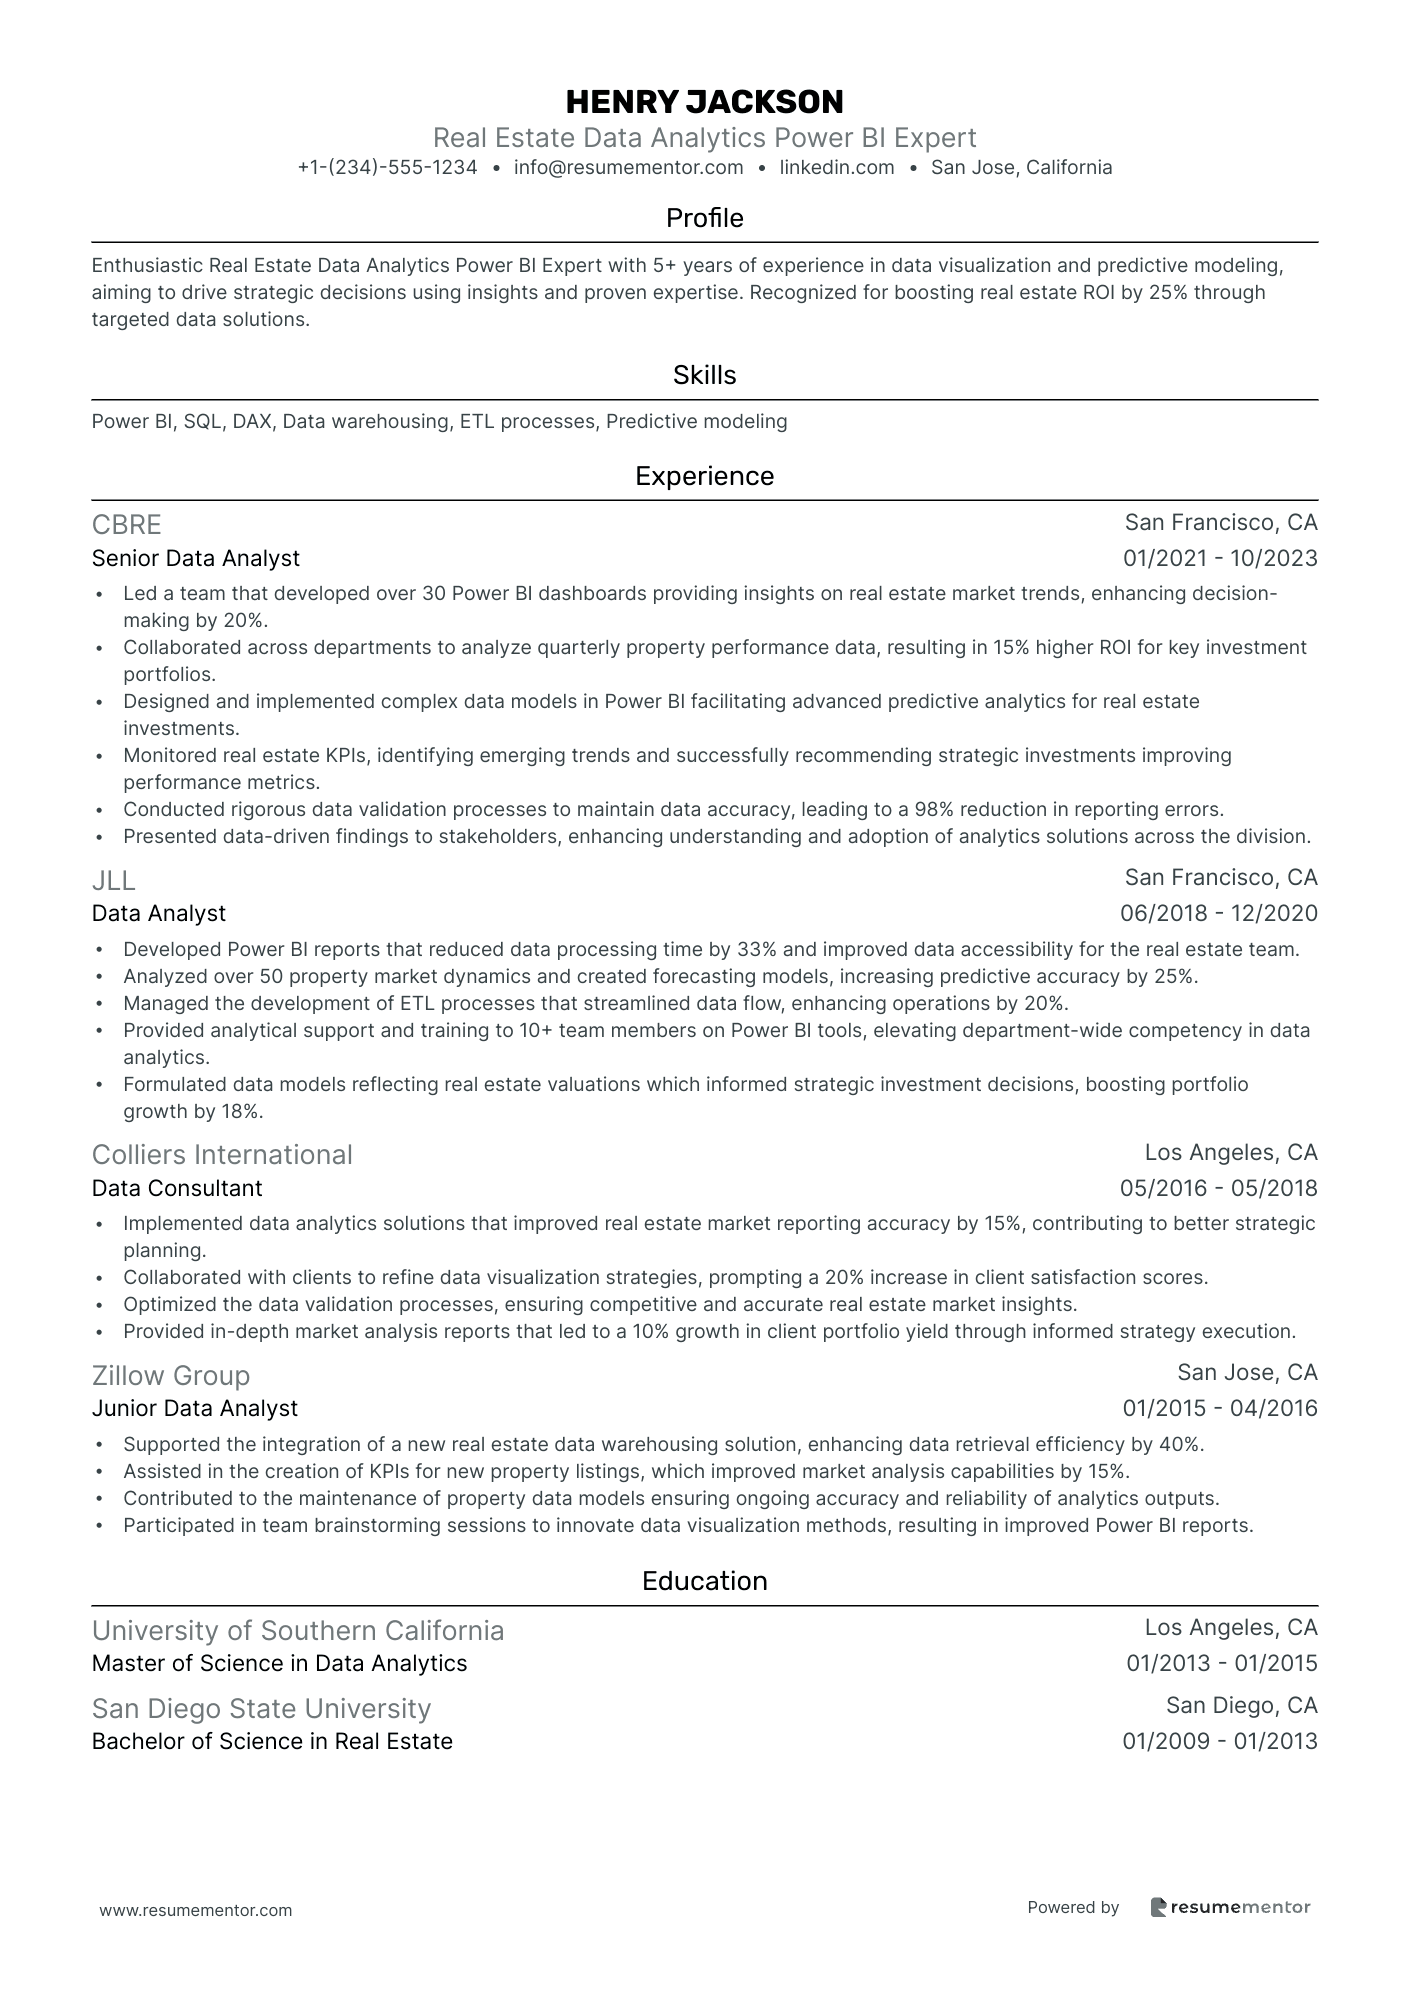
Real Estate Data Analytics Power BI Expert
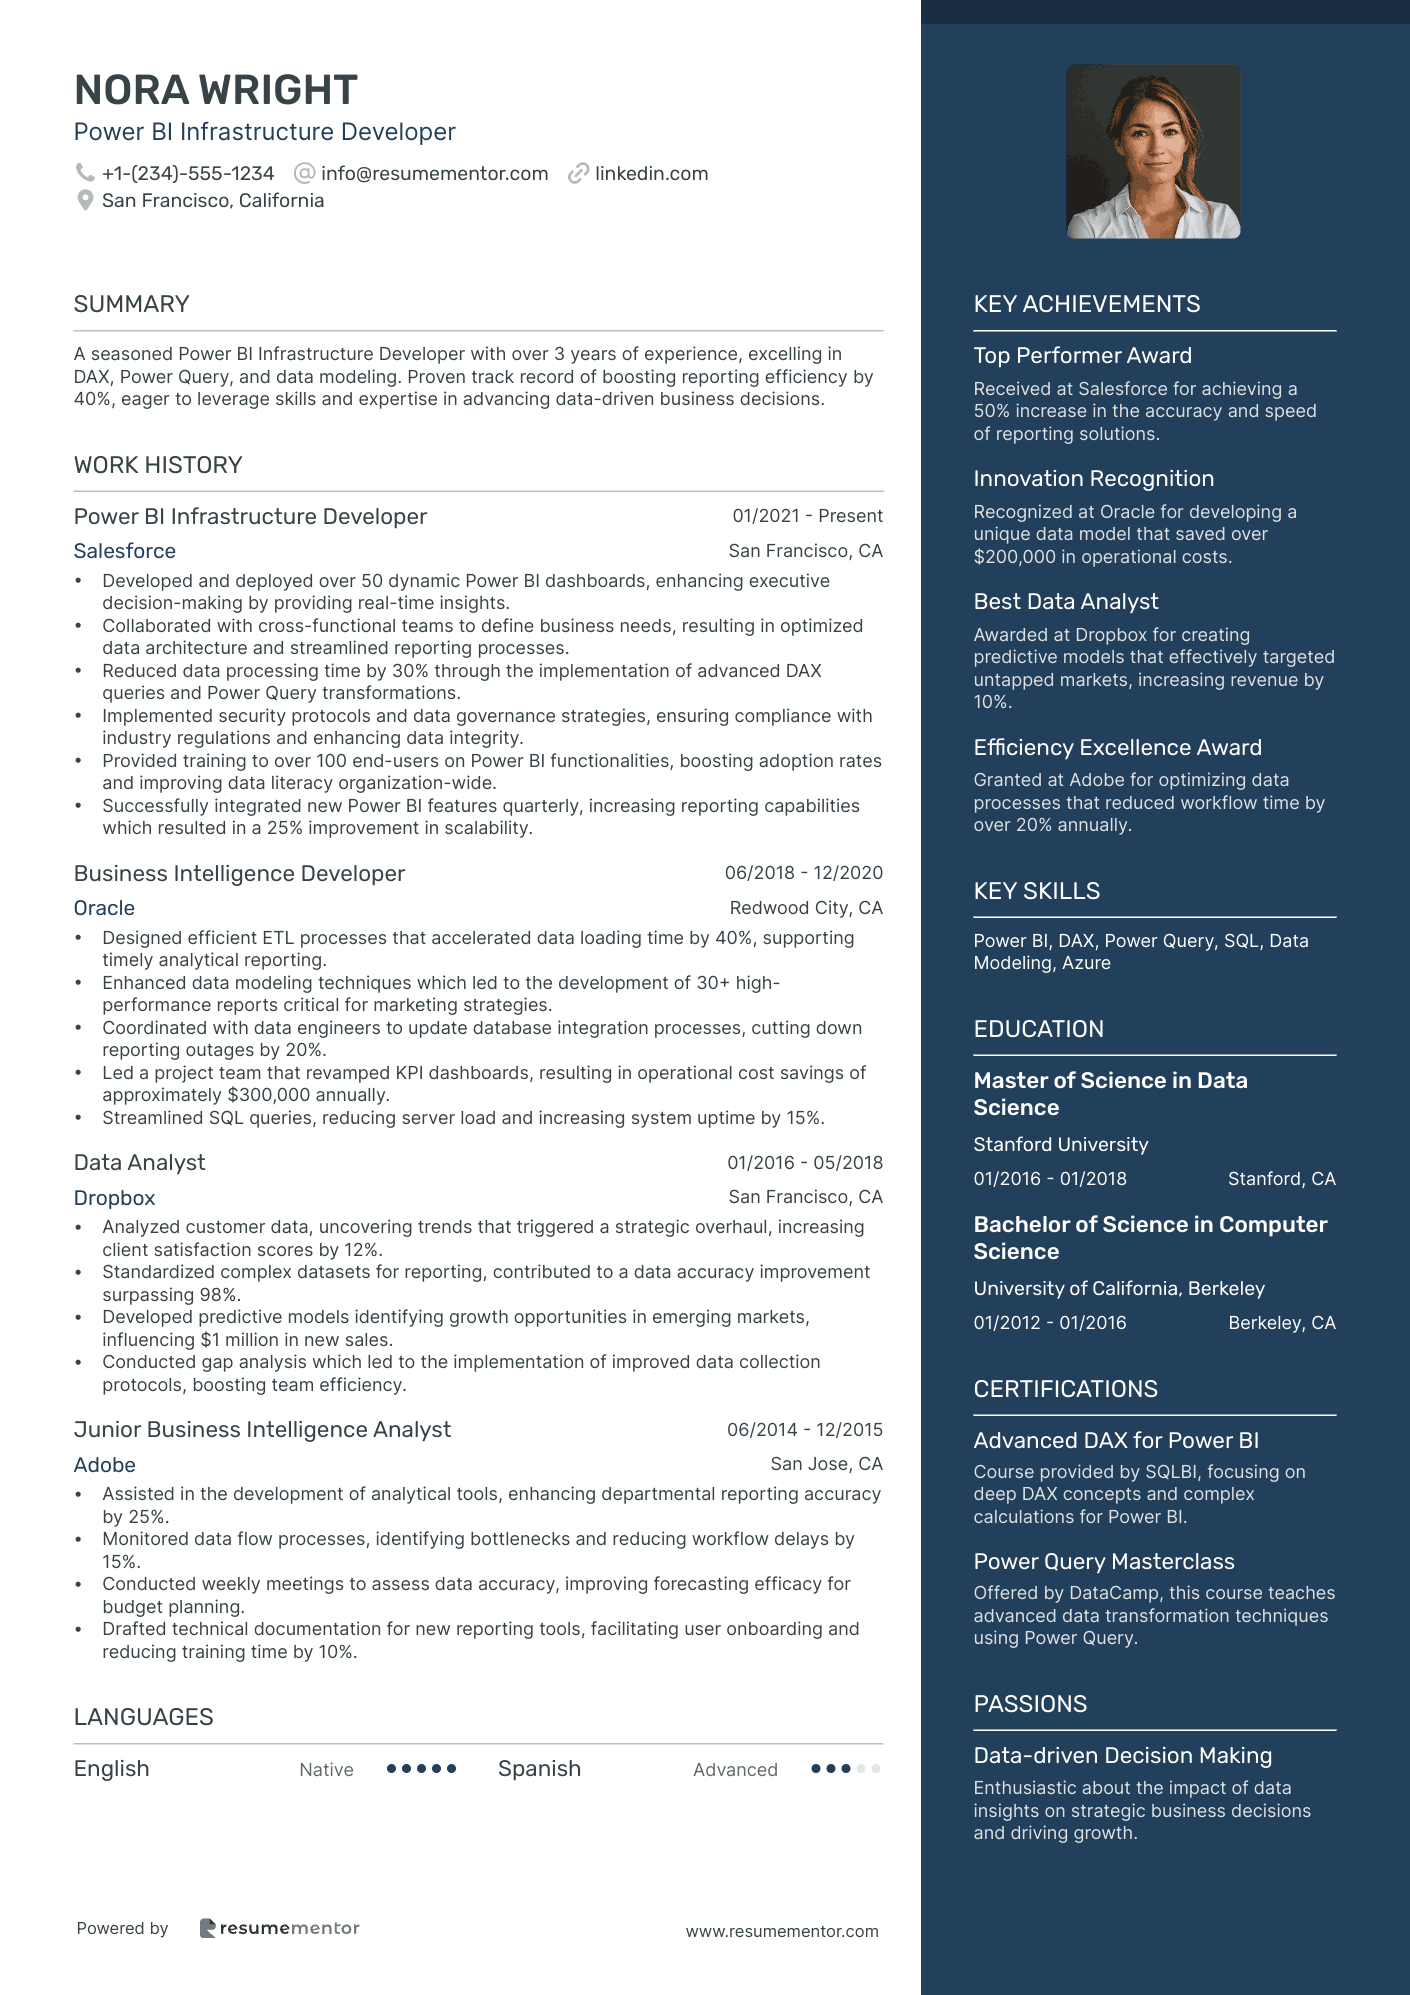
Power BI Infrastructure Developer
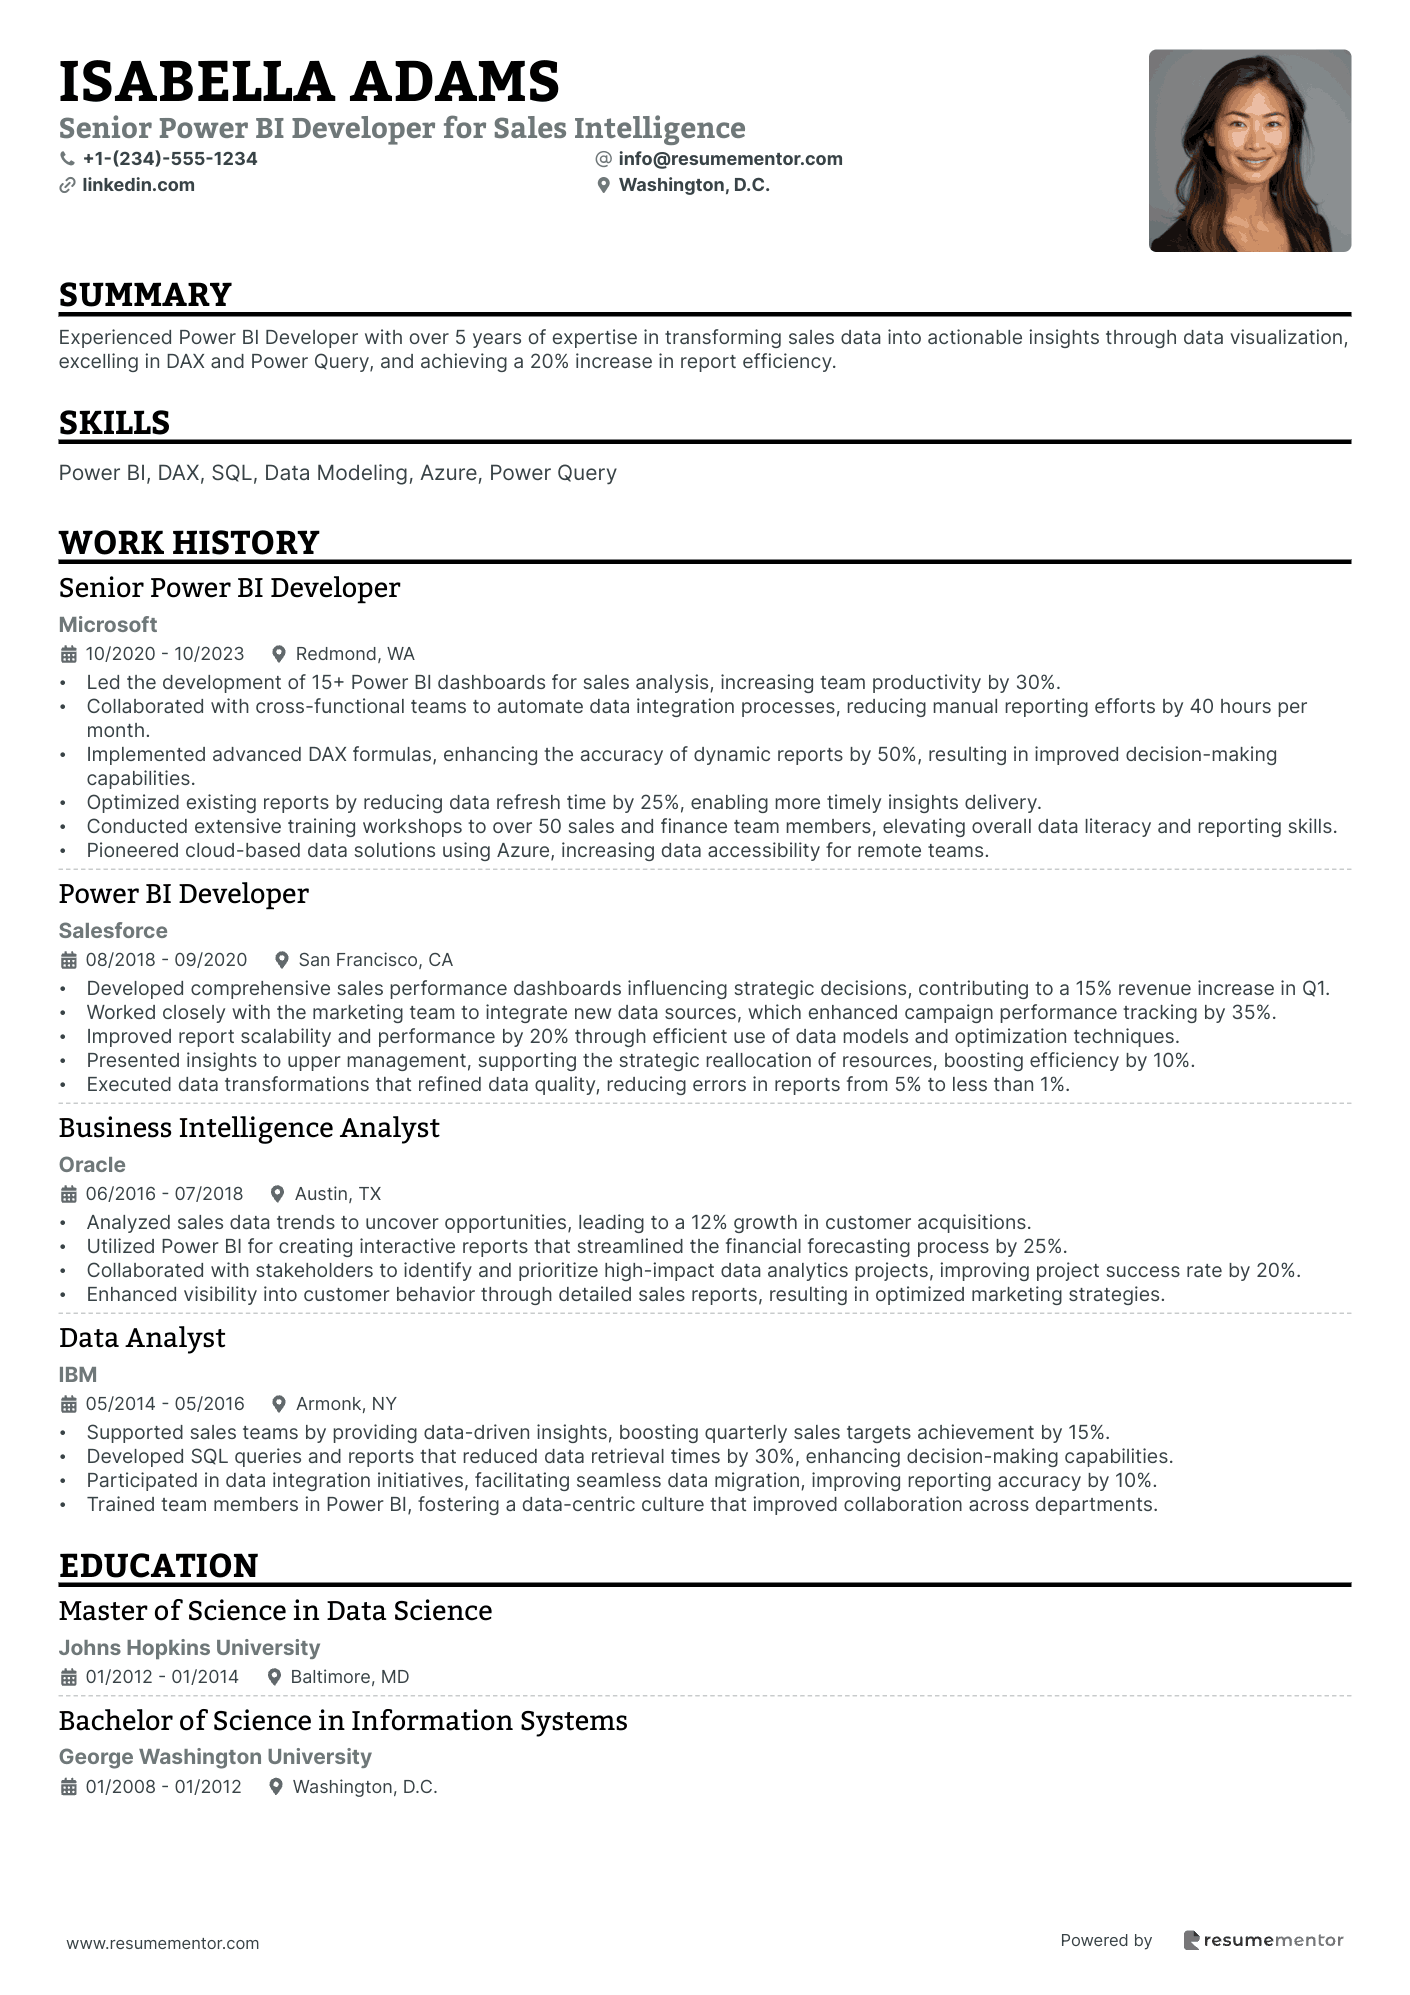
Senior Power BI Developer for Sales Intelligence
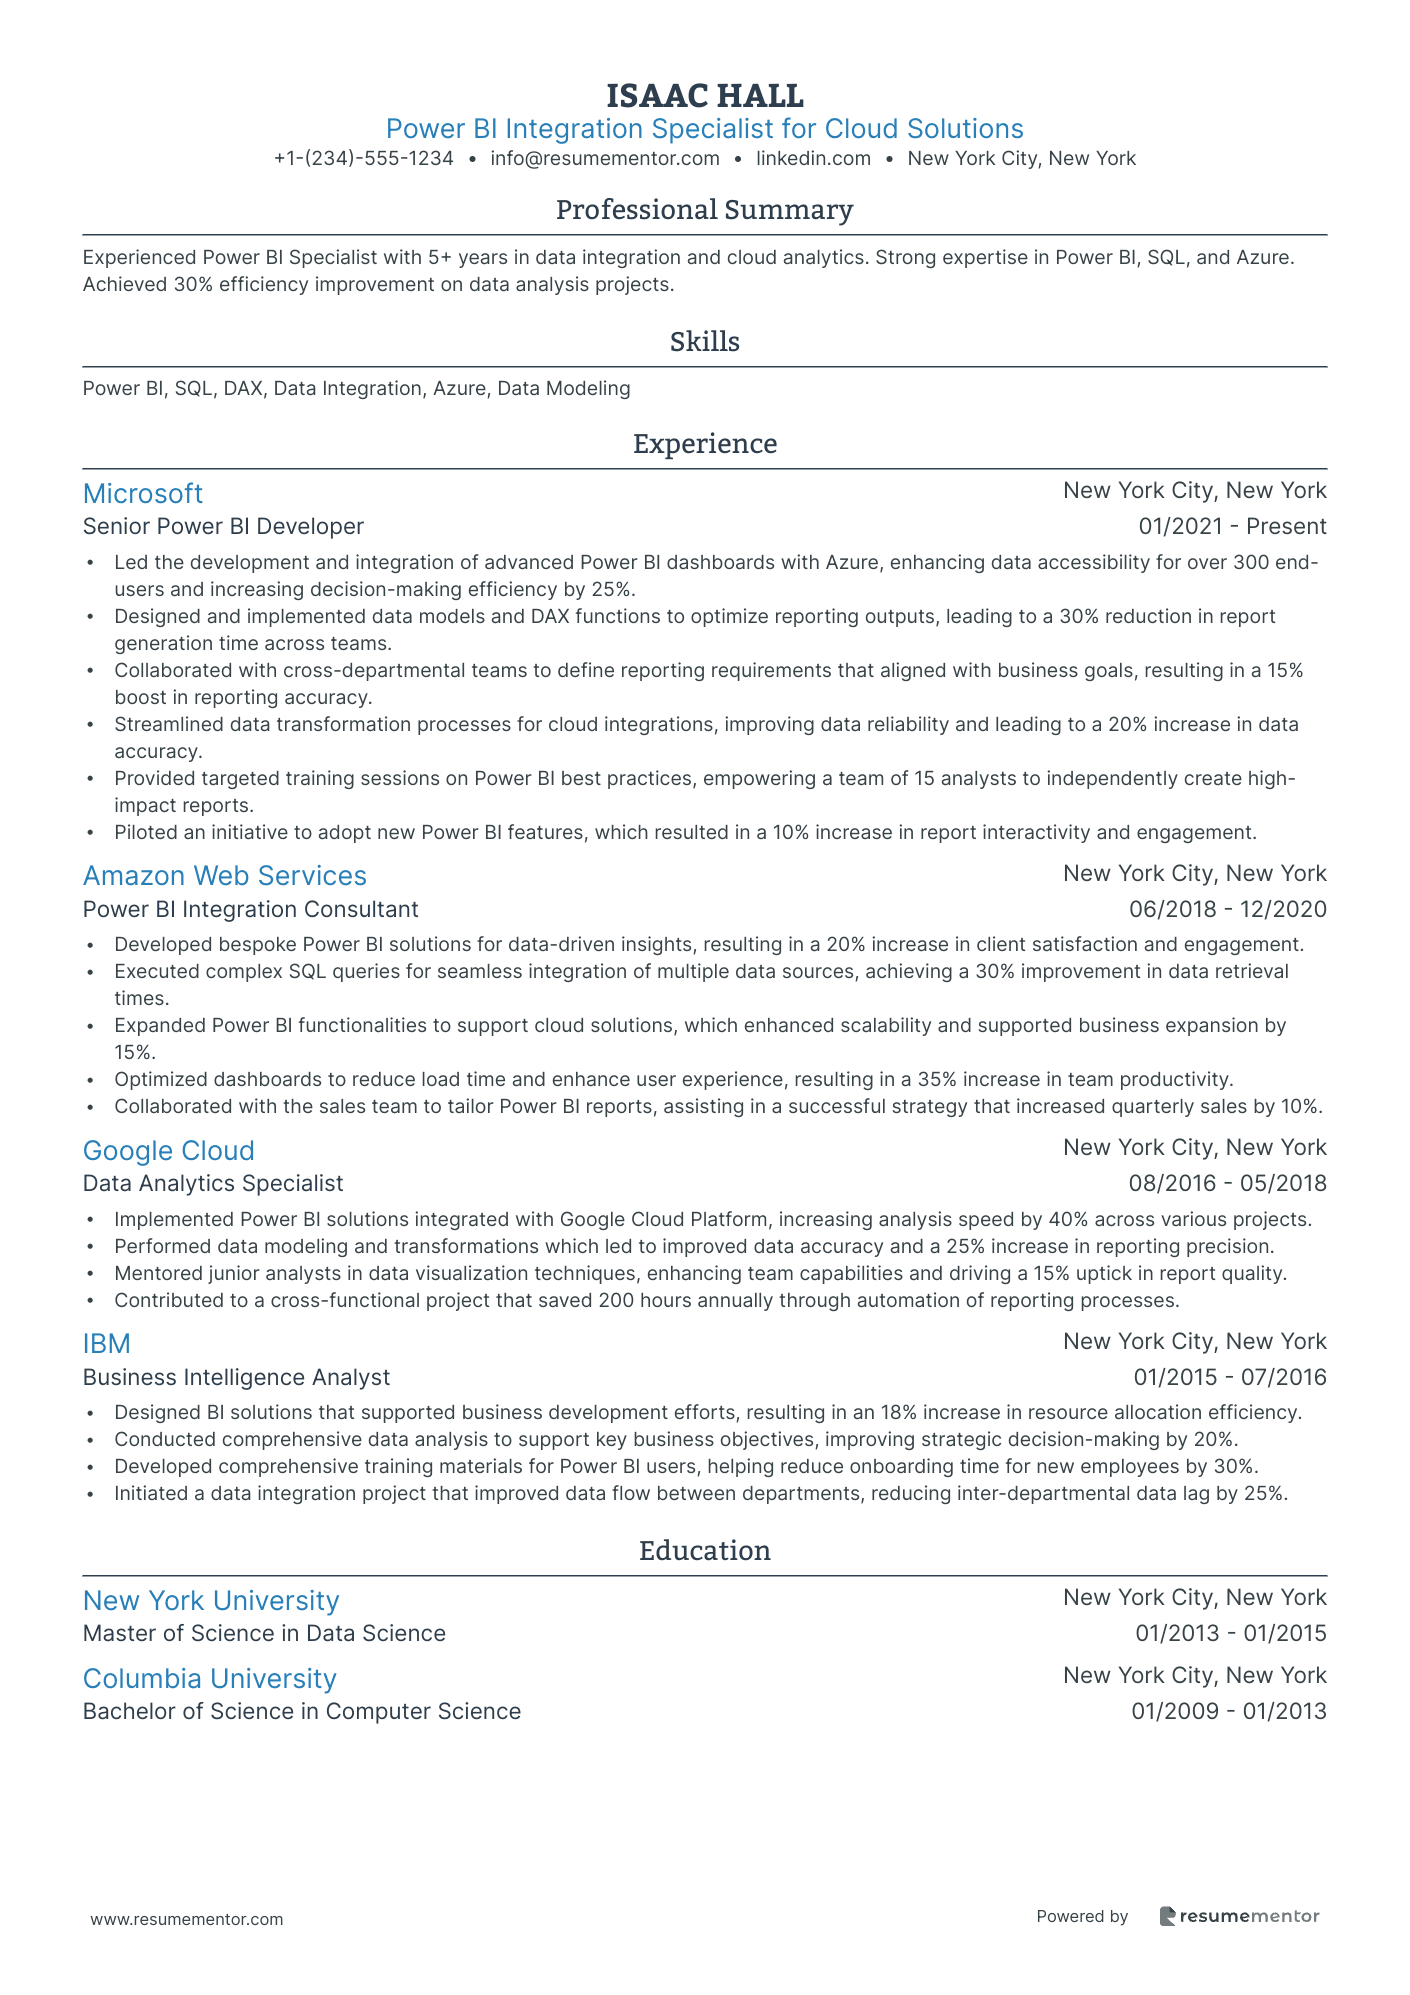
Power BI Integration Specialist for Cloud Solutions
Telecommunications Power BI Analysis Expert
Power BI Developer for Marketing Analytics.

Power BI Developer for Financial Analytics resume sample
- •Led a team to design over 20 Power BI dashboards, enhancing financial visibility by 30% across divisional teams.
- •Collaborated with cross-functional teams to facilitate data-driven decisions, reducing reporting time by 25%.
- •Deployed a robust data validation system, improving accuracy of financial reports by 15%.
- •Provided training sessions to 50+ team members, elevating Power BI utilization and skills across the department.
- •Optimized Power BI data models and DAX formulas, leading to a 40% query performance improvement.
- •Integrated external data sources, resulting in comprehensive financial insights and strategic planning capabilities.
- •Developed detailed financial reports and dashboards to monitor KPIs, achieving a 20% increase in data-driven decisions.
- •Managed ETL processes to harmonize data from disparate sources, streamlining data for cohesive reporting.
- •Executed complex DAX calculations for advanced analytics, enhancing report depth by 15%.
- •Engaged with stakeholders to gather requirements, ensuring accuracy and relevance in reporting outputs.
- •Piloted a new forecasting model, resulting in a 10% improvement in budget accuracy and profiling.
- •Conducted in-depth financial data analysis leading to a 12% reduction in operational costs through efficient resource management.
- •Assisted in building comprehensive data models to support strategic business planning initiatives.
- •Validated data accuracy and integrity for high-stakes financial presentations and reporting.
- •Delivered insights using Power BI that informed executive-level strategic directions and initiatives.
- •Supported the finance team in developing robust financial reports with Power BI for government compliance, boosting efficiency by 20%.
- •Developed data visualizations that simplified complex datasets for easy understanding by non-technical stakeholders.
- •Collaborated in fixing data discrepancies across platforms, ensuring data consistency across financial systems.
- •Enhanced data capture processes, resulting in more accurate and timely financial reporting capabilities.
Healthcare Data Analysis Power BI Developer resume sample
- •Developed over 30 interactive Power BI dashboards leading to a 25% improvement in data accessibility and operational efficiency across various departments.
- •Collaborated with clinical staff to identify and visualize key healthcare metrics, resulting in more informed decision-making and enhanced patient care.
- •Conducted thorough analysis of patient data, identifying trends and anomalies that informed protocol adjustments, reducing readmission rates by 15%.
- •Led cross-functional teams to implement data quality initiatives that improved data accuracy by 20%, enhancing overall analysis reliability.
- •Managed multiple projects simultaneously, ensuring timely delivery and adherence to stakeholder requirements, resulting in a 40% increase in user satisfaction.
- •Educated team members on best practices in data visualization, contributing to an 80% proficiency increase among regular Power BI users.
- •Engineered comprehensive SQL queries and ETL processes to manage large datasets, enhancing data processing speed by 30% across the team.
- •Built healthcare-specific data models that improved analytics capabilities, aiding executives in strategic planning.
- •Designed KPI dashboards that empowered physicians to track real-time patient outcomes, which reduced reporting errors by 20%.
- •Facilitated data governance workshops, improving organizational data integrity and compliance with industry standards.
- •Cultivated strong relationships with key stakeholders, leading to collaborative projects that generated $1M in annual cost savings.
- •Analyzed patterns in healthcare data, producing reports that helped reduce patient wait times by 10% in outpatient services.
- •Streamlined data collection processes, resulting in a 50% time-saving on monthly performance reports.
- •Collaborated with IT to design a secure data pipeline, ensuring patient data confidentiality and compliance with HIPAA regulations.
- •Led data visualizations workshops that enhanced team-wide analytical skills, effectively bridging the gap between complex data and actionable insights.
- •Worked on a team project that migrated critical healthcare datasets to a new data warehouse, boosting analytics performance by 40%.
- •Created actionable insights from data analysis that improved clinical operations, achieving a 15% reduction in operational costs.
- •Implemented data validation protocols, leading to a 95% accuracy rate in data reporting.
- •Trained new analysts in SQL and Power BI, fostering a collaborative learning environment and improving team productivity.
Senior Power BI Consultant for Retail Metrics resume sample
- •Developed and optimized Power BI dashboards that improved client retail metrics visibility by 40%, leading to strategic decision-making.
- •Led cross-functional teams to define data requirements, resulting in a 15% improvement in operational efficiency for retail clients.
- •Conducted in-depth data analysis across multiple retail channels, uncovering $500,000 in potential revenue streams.
- •Provided expert advice on data visualization best practices, aligning with client retail strategies for a better bottom line.
- •Trained over 50 internal and client stakeholders on Power BI utilization, increasing data-driven decision-making capability by 30%.
- •Recommended process enhancements leading to a 20% reduction in reporting times.
- •Created Power BI reports that resulted in a 10% increase in insights adoption among retail clients.
- •Streamlined reporting processes that reduced manual reporting time by 25% by leveraging SQL and advanced DAX functions.
- •Collaborated with data engineering teams to ensure data integrity, enhancing data quality for analysis purposes by 15%.
- •Identified key retail trends and opportunities, contributing to a 12% year-over-year growth in client sales.
- •Enhanced client data management practices through expert advice, leading to more strategic data usage.
- •Designed and maintained Power BI reports, increasing KPI visibility for management by 30%.
- •Worked closely with business units to define reporting needs, enabling more targeted customer engagement strategies.
- •Provided actionable retail insights that contributed to a 20% improvement in promotional effectiveness.
- •Participated in a project that integrated new data sources, enhancing overall reporting capabilities.
- •Supported BI initiatives by analyzing complex datasets, improving retail data reporting accuracy by 15%.
- •Interpreted sales data to identify customer buying patterns, positively impacting marketing strategies.
- •Contributed to the development of data models that sped up reporting times by 20%.
- •Collaborated with senior analysts to ensure data relevancy and accuracy.
Power BI Developer Specializing in Manufacturing Analytics resume sample
- •Developed and optimized over 50 Power BI dashboards, improving insights and decision-making capabilities by 30%.
- •Collaborated with quality assurance teams to integrate real-time data, reducing manufacturing defects by 15%.
- •Led cross-functional teams in defining KPIs for new product lines, enhancing production visibility by 20%.
- •Conducted comprehensive data validation for critical operations, maintaining data accuracy above 95% consistently.
- •Trained over 150 staff members on Power BI tool usage, resulting in increased company-wide analytics adoption.
- •Facilitated regular workshops on manufacturing analytics innovations, driving a culture of data-driven improvements.
- •Architected Power BI solutions for complex datasets, enhancing manufacturing report accuracy by 25%.
- •Worked closely with supply chain teams to develop dashboards that reduced lead times by 18%.
- •Optimized existing reports, significantly boosting performance by an average of 40%.
- •Partnered with IT teams to improve ETL processes, resulting in faster data refresh rates by 50%.
- •Implemented a robust DAX library, reducing report development time by nearly 30%.
- •Analyzed extensive datasets to forecast manufacturing cycles, boosting accuracy in demand planning by 20%.
- •Collaborated with operations teams to create reports tracking OEE, reducing downtime by 12%.
- •Automated recurring reports, saving 10 hours per week of manual analysis and providing timely insights.
- •Facilitated cross-departmental workshops to identify new KPI metrics, enhancing report relevance.
- •Designed data models supporting strategic manufacturing decisions, increasing throughput by 15%.
- •Supported stakeholders in interpreting structured data, directing improvements in process efficiency by 5%.
- •Participated in planning sessions to refine analytics strategy, aligning project goals company-wide.
- •Successfully led data integration projects across multiple manufacturing ERP systems, ensuring seamless data flows.
Real Estate Data Analytics Power BI Expert resume sample
- •Led a team that developed over 30 Power BI dashboards providing insights on real estate market trends, enhancing decision-making by 20%.
- •Collaborated across departments to analyze quarterly property performance data, resulting in 15% higher ROI for key investment portfolios.
- •Designed and implemented complex data models in Power BI facilitating advanced predictive analytics for real estate investments.
- •Monitored real estate KPIs, identifying emerging trends and successfully recommending strategic investments improving performance metrics.
- •Conducted rigorous data validation processes to maintain data accuracy, leading to a 98% reduction in reporting errors.
- •Presented data-driven findings to stakeholders, enhancing understanding and adoption of analytics solutions across the division.
- •Developed Power BI reports that reduced data processing time by 33% and improved data accessibility for the real estate team.
- •Analyzed over 50 property market dynamics and created forecasting models, increasing predictive accuracy by 25%.
- •Managed the development of ETL processes that streamlined data flow, enhancing operations by 20%.
- •Provided analytical support and training to 10+ team members on Power BI tools, elevating department-wide competency in data analytics.
- •Formulated data models reflecting real estate valuations which informed strategic investment decisions, boosting portfolio growth by 18%.
- •Implemented data analytics solutions that improved real estate market reporting accuracy by 15%, contributing to better strategic planning.
- •Collaborated with clients to refine data visualization strategies, prompting a 20% increase in client satisfaction scores.
- •Optimized the data validation processes, ensuring competitive and accurate real estate market insights.
- •Provided in-depth market analysis reports that led to a 10% growth in client portfolio yield through informed strategy execution.
- •Supported the integration of a new real estate data warehousing solution, enhancing data retrieval efficiency by 40%.
- •Assisted in the creation of KPIs for new property listings, which improved market analysis capabilities by 15%.
- •Contributed to the maintenance of property data models ensuring ongoing accuracy and reliability of analytics outputs.
- •Participated in team brainstorming sessions to innovate data visualization methods, resulting in improved Power BI reports.
Power BI Infrastructure Developer resume sample
- •Developed and deployed over 50 dynamic Power BI dashboards, enhancing executive decision-making by providing real-time insights.
- •Collaborated with cross-functional teams to define business needs, resulting in optimized data architecture and streamlined reporting processes.
- •Reduced data processing time by 30% through the implementation of advanced DAX queries and Power Query transformations.
- •Implemented security protocols and data governance strategies, ensuring compliance with industry regulations and enhancing data integrity.
- •Provided training to over 100 end-users on Power BI functionalities, boosting adoption rates and improving data literacy organization-wide.
- •Successfully integrated new Power BI features quarterly, increasing reporting capabilities which resulted in a 25% improvement in scalability.
- •Designed efficient ETL processes that accelerated data loading time by 40%, supporting timely analytical reporting.
- •Enhanced data modeling techniques which led to the development of 30+ high-performance reports critical for marketing strategies.
- •Coordinated with data engineers to update database integration processes, cutting down reporting outages by 20%.
- •Led a project team that revamped KPI dashboards, resulting in operational cost savings of approximately $300,000 annually.
- •Streamlined SQL queries, reducing server load and increasing system uptime by 15%.
- •Analyzed customer data, uncovering trends that triggered a strategic overhaul, increasing client satisfaction scores by 12%.
- •Standardized complex datasets for reporting, contributed to a data accuracy improvement surpassing 98%.
- •Developed predictive models identifying growth opportunities in emerging markets, influencing $1 million in new sales.
- •Conducted gap analysis which led to the implementation of improved data collection protocols, boosting team efficiency.
- •Assisted in the development of analytical tools, enhancing departmental reporting accuracy by 25%.
- •Monitored data flow processes, identifying bottlenecks and reducing workflow delays by 15%.
- •Conducted weekly meetings to assess data accuracy, improving forecasting efficacy for budget planning.
- •Drafted technical documentation for new reporting tools, facilitating user onboarding and reducing training time by 10%.
Senior Power BI Developer for Sales Intelligence resume sample
- •Led the development of 15+ Power BI dashboards for sales analysis, increasing team productivity by 30%.
- •Collaborated with cross-functional teams to automate data integration processes, reducing manual reporting efforts by 40 hours per month.
- •Implemented advanced DAX formulas, enhancing the accuracy of dynamic reports by 50%, resulting in improved decision-making capabilities.
- •Optimized existing reports by reducing data refresh time by 25%, enabling more timely insights delivery.
- •Conducted extensive training workshops to over 50 sales and finance team members, elevating overall data literacy and reporting skills.
- •Pioneered cloud-based data solutions using Azure, increasing data accessibility for remote teams.
- •Developed comprehensive sales performance dashboards influencing strategic decisions, contributing to a 15% revenue increase in Q1.
- •Worked closely with the marketing team to integrate new data sources, which enhanced campaign performance tracking by 35%.
- •Improved report scalability and performance by 20% through efficient use of data models and optimization techniques.
- •Presented insights to upper management, supporting the strategic reallocation of resources, boosting efficiency by 10%.
- •Executed data transformations that refined data quality, reducing errors in reports from 5% to less than 1%.
- •Analyzed sales data trends to uncover opportunities, leading to a 12% growth in customer acquisitions.
- •Utilized Power BI for creating interactive reports that streamlined the financial forecasting process by 25%.
- •Collaborated with stakeholders to identify and prioritize high-impact data analytics projects, improving project success rate by 20%.
- •Enhanced visibility into customer behavior through detailed sales reports, resulting in optimized marketing strategies.
- •Supported sales teams by providing data-driven insights, boosting quarterly sales targets achievement by 15%.
- •Developed SQL queries and reports that reduced data retrieval times by 30%, enhancing decision-making capabilities.
- •Participated in data integration initiatives, facilitating seamless data migration, improving reporting accuracy by 10%.
- •Trained team members in Power BI, fostering a data-centric culture that improved collaboration across departments.
Power BI Integration Specialist for Cloud Solutions resume sample
- •Led the development and integration of advanced Power BI dashboards with Azure, enhancing data accessibility for over 300 end-users and increasing decision-making efficiency by 25%.
- •Designed and implemented data models and DAX functions to optimize reporting outputs, leading to a 30% reduction in report generation time across teams.
- •Collaborated with cross-departmental teams to define reporting requirements that aligned with business goals, resulting in a 15% boost in reporting accuracy.
- •Streamlined data transformation processes for cloud integrations, improving data reliability and leading to a 20% increase in data accuracy.
- •Provided targeted training sessions on Power BI best practices, empowering a team of 15 analysts to independently create high-impact reports.
- •Piloted an initiative to adopt new Power BI features, which resulted in a 10% increase in report interactivity and engagement.
- •Developed bespoke Power BI solutions for data-driven insights, resulting in a 20% increase in client satisfaction and engagement.
- •Executed complex SQL queries for seamless integration of multiple data sources, achieving a 30% improvement in data retrieval times.
- •Expanded Power BI functionalities to support cloud solutions, which enhanced scalability and supported business expansion by 15%.
- •Optimized dashboards to reduce load time and enhance user experience, resulting in a 35% increase in team productivity.
- •Collaborated with the sales team to tailor Power BI reports, assisting in a successful strategy that increased quarterly sales by 10%.
- •Implemented Power BI solutions integrated with Google Cloud Platform, increasing analysis speed by 40% across various projects.
- •Performed data modeling and transformations which led to improved data accuracy and a 25% increase in reporting precision.
- •Mentored junior analysts in data visualization techniques, enhancing team capabilities and driving a 15% uptick in report quality.
- •Contributed to a cross-functional project that saved 200 hours annually through automation of reporting processes.
- •Designed BI solutions that supported business development efforts, resulting in an 18% increase in resource allocation efficiency.
- •Conducted comprehensive data analysis to support key business objectives, improving strategic decision-making by 20%.
- •Developed comprehensive training materials for Power BI users, helping reduce onboarding time for new employees by 30%.
- •Initiated a data integration project that improved data flow between departments, reducing inter-departmental data lag by 25%.
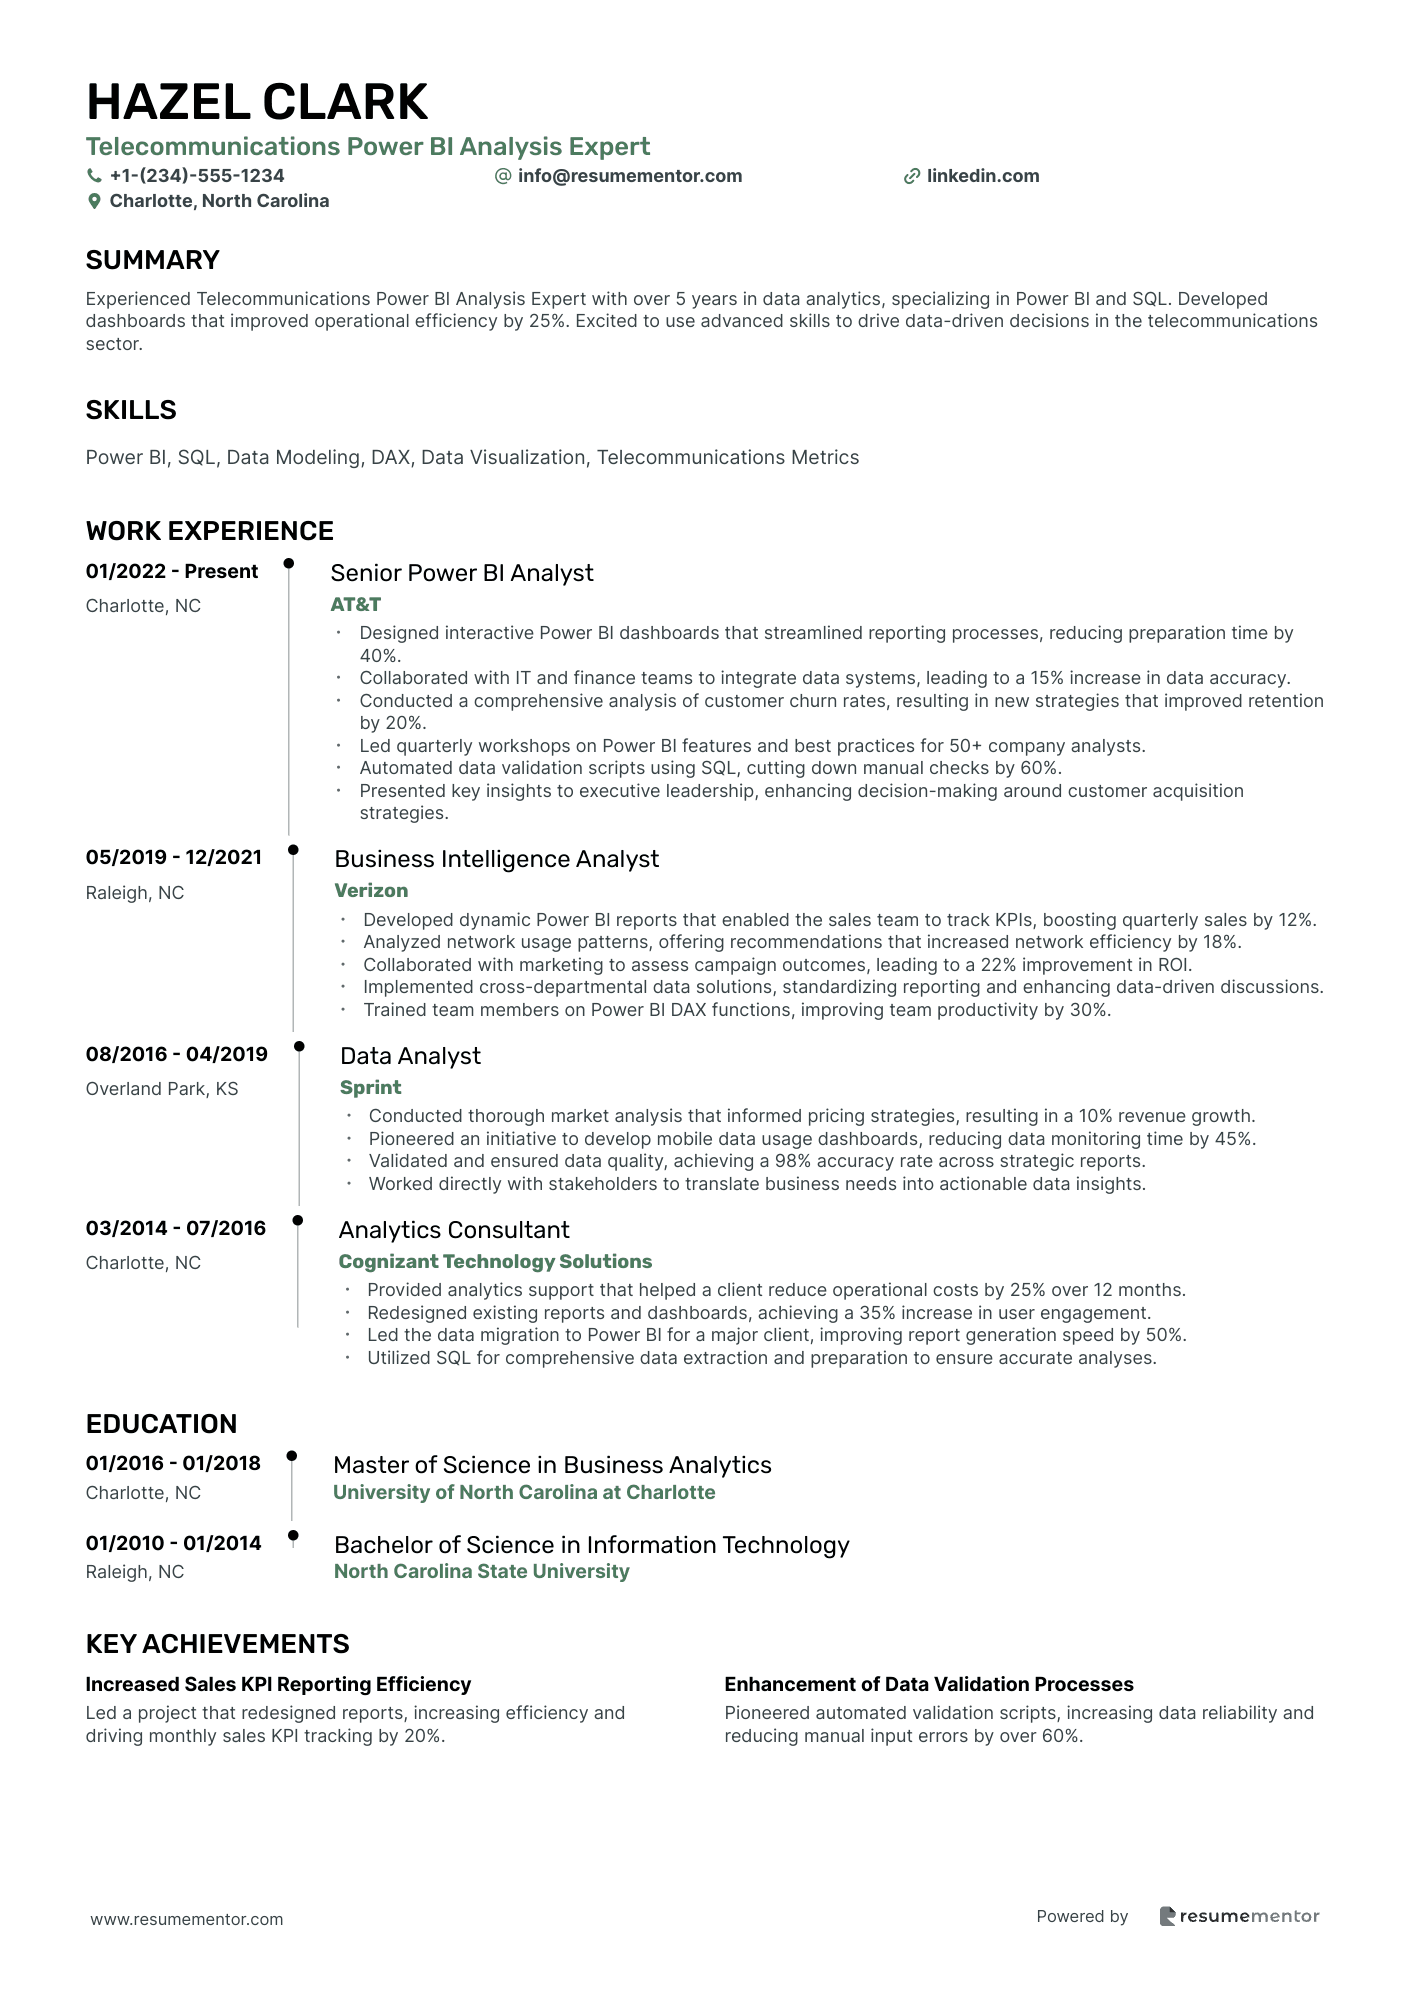
Telecommunications Power BI Analysis Expert resume sample
- •Designed interactive Power BI dashboards that streamlined reporting processes, reducing preparation time by 40%.
- •Collaborated with IT and finance teams to integrate data systems, leading to a 15% increase in data accuracy.
- •Conducted a comprehensive analysis of customer churn rates, resulting in new strategies that improved retention by 20%.
- •Led quarterly workshops on Power BI features and best practices for 50+ company analysts.
- •Automated data validation scripts using SQL, cutting down manual checks by 60%.
- •Presented key insights to executive leadership, enhancing decision-making around customer acquisition strategies.
- •Developed dynamic Power BI reports that enabled the sales team to track KPIs, boosting quarterly sales by 12%.
- •Analyzed network usage patterns, offering recommendations that increased network efficiency by 18%.
- •Collaborated with marketing to assess campaign outcomes, leading to a 22% improvement in ROI.
- •Implemented cross-departmental data solutions, standardizing reporting and enhancing data-driven discussions.
- •Trained team members on Power BI DAX functions, improving team productivity by 30%.
- •Conducted thorough market analysis that informed pricing strategies, resulting in a 10% revenue growth.
- •Pioneered an initiative to develop mobile data usage dashboards, reducing data monitoring time by 45%.
- •Validated and ensured data quality, achieving a 98% accuracy rate across strategic reports.
- •Worked directly with stakeholders to translate business needs into actionable data insights.
- •Provided analytics support that helped a client reduce operational costs by 25% over 12 months.
- •Redesigned existing reports and dashboards, achieving a 35% increase in user engagement.
- •Led the data migration to Power BI for a major client, improving report generation speed by 50%.
- •Utilized SQL for comprehensive data extraction and preparation to ensure accurate analyses.
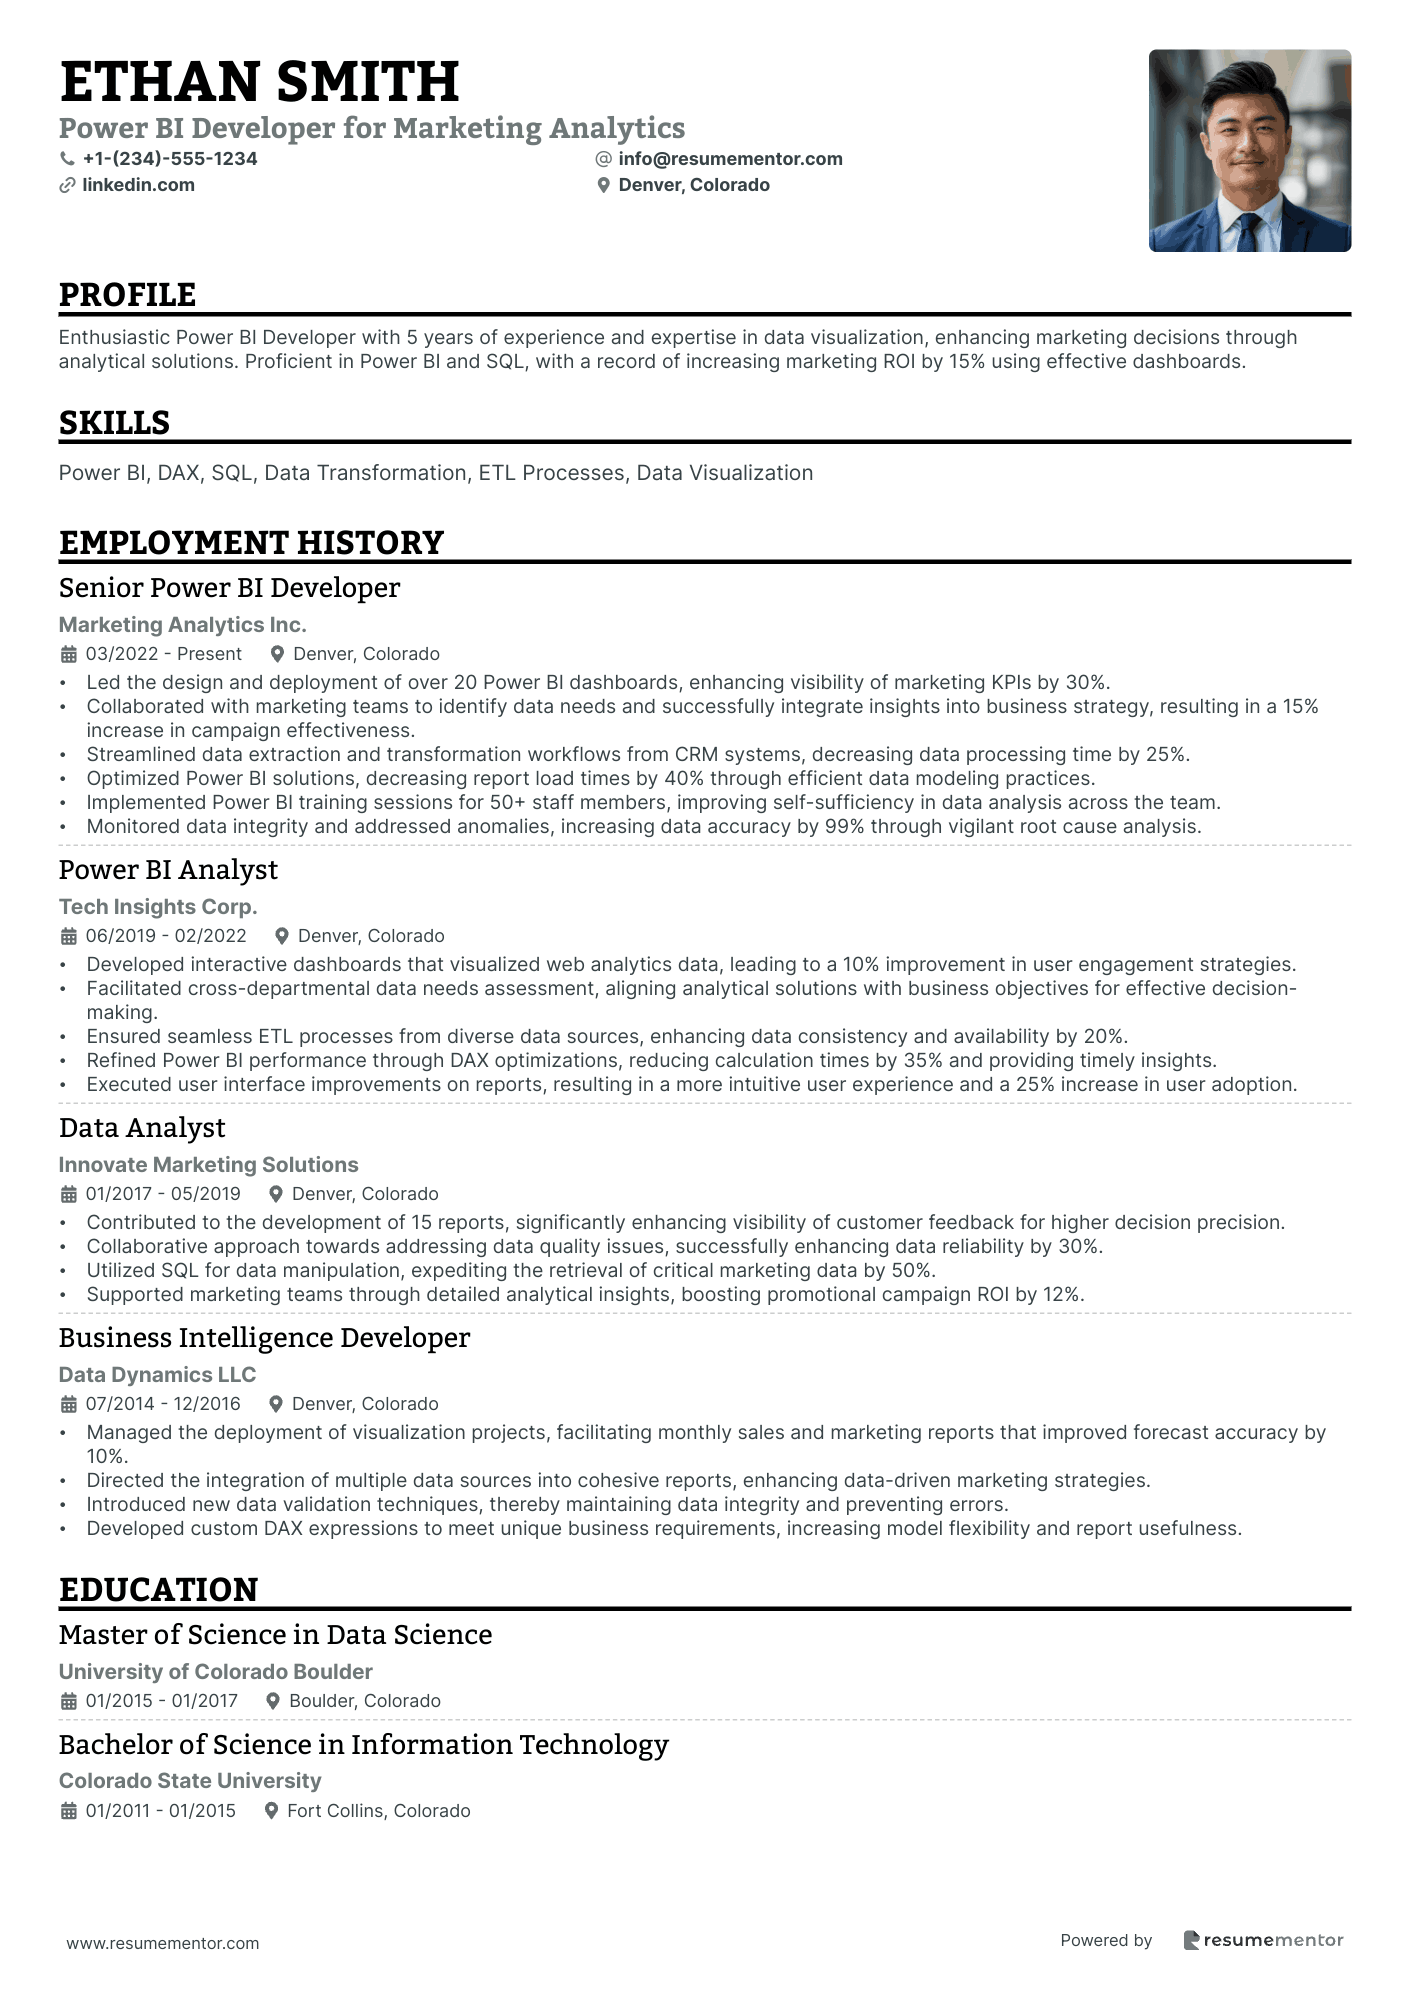
Power BI Developer for Marketing Analytics. resume sample
- •Led the design and deployment of over 20 Power BI dashboards, enhancing visibility of marketing KPIs by 30%.
- •Collaborated with marketing teams to identify data needs and successfully integrate insights into business strategy, resulting in a 15% increase in campaign effectiveness.
- •Streamlined data extraction and transformation workflows from CRM systems, decreasing data processing time by 25%.
- •Optimized Power BI solutions, decreasing report load times by 40% through efficient data modeling practices.
- •Implemented Power BI training sessions for 50+ staff members, improving self-sufficiency in data analysis across the team.
- •Monitored data integrity and addressed anomalies, increasing data accuracy by 99% through vigilant root cause analysis.
- •Developed interactive dashboards that visualized web analytics data, leading to a 10% improvement in user engagement strategies.
- •Facilitated cross-departmental data needs assessment, aligning analytical solutions with business objectives for effective decision-making.
- •Ensured seamless ETL processes from diverse data sources, enhancing data consistency and availability by 20%.
- •Refined Power BI performance through DAX optimizations, reducing calculation times by 35% and providing timely insights.
- •Executed user interface improvements on reports, resulting in a more intuitive user experience and a 25% increase in user adoption.
- •Contributed to the development of 15 reports, significantly enhancing visibility of customer feedback for higher decision precision.
- •Collaborative approach towards addressing data quality issues, successfully enhancing data reliability by 30%.
- •Utilized SQL for data manipulation, expediting the retrieval of critical marketing data by 50%.
- •Supported marketing teams through detailed analytical insights, boosting promotional campaign ROI by 12%.
- •Managed the deployment of visualization projects, facilitating monthly sales and marketing reports that improved forecast accuracy by 10%.
- •Directed the integration of multiple data sources into cohesive reports, enhancing data-driven marketing strategies.
- •Introduced new data validation techniques, thereby maintaining data integrity and preventing errors.
- •Developed custom DAX expressions to meet unique business requirements, increasing model flexibility and report usefulness.
Creating a standout Power BI developer resume is akin to designing the perfect data visualization—it demands clarity and precision, much like your daily work. You know presenting your skills effectively is crucial, yet capturing this on a resume can often feel overwhelming. It involves turning your rich experience with Power BI into concise, impactful statements that immediately draw attention.
Standing out in the job market means effectively showcasing your skills and projects. Employers have specific competencies in mind, and conveying your analytical prowess in a resume format that speaks their language is key. This is where a well-structured resume template becomes your ally. Platforms like Resume Mentor offer templates that ensure your resume meets professional standards, making the writing process smoother.
Through this guide, you'll learn how to clearly present your achievements and align your experience with job requirements. These insights will help you strategically position yourself in the competitive job market. Your resume is more than just a document; it’s a personalized billboard that showcases your ability to transform data into actionable insights using Power BI. Let’s work together to ensure it truly reflects your best work!
Key Takeaways
- Creating a standout resume for a Power BI developer involves highlighting your skills in data visualization and report creation, making you an asset to any team.
- Structured resume templates can significantly enhance your resume, ensuring it meets professional standards and effectively showcases your competencies.
- Highlighting impactful achievements and aligning your experience with job requirements is crucial in the competitive job market.
- Integrating a clear professional summary, relevant technical skills, and quantifiable experiences helps convey your analytical prowess to potential employers.
- Including certifications, education, and extra sections like languages and volunteer work can provide insight into your personal skills and interests, setting you apart from other candidates.
What to focus on when writing your Power BI developer resume
Your Power BI developer resume should clearly convey your knack for transforming data into actionable insights, making you an asset to any team. By emphasizing your skills in data visualization and report creation, you can effectively impress recruiters.
How to structure your Power BI developer resume
- Contact Information: Start with your full name, phone number, email address, and LinkedIn profile, ensuring this information is easy to find and always current to facilitate communication. A professional email address goes a long way; it's often the first impression you make. LinkedIn profiles should showcase endorsements and connections that reflect your area of expertise—paving the way for easier networking and validating your authority in the field with recruiters.
- Professional Summary: Follow with a short introduction that highlights your background in data analysis and your expertise in Power BI, emphasizing your ability to convert complex datasets into clear visual stories that drive decision-making. Tailor this section to align with what the company values most; use terminology from the job description to make it more relevant—hooking the recruiter’s attention from the start and setting the stage for the specific examples in your experience.
- Technical Skills: Next, list key skills like Power BI, DAX, SQL, and data modeling, and include tools such as Azure or relevant programming languages like Python, showing your comprehensive technical expertise. Illuminate your proficiency levels and relate how you’ve applied these skills practically on projects—showing that your skill set isn’t just theoretical but put to good use in real-world applications.
- Professional Experience: Build on your skills by detailing relevant work experience. Include your role, company name, location, and dates, focusing on responsibilities and achievements directly linked to Power BI projects to demonstrate your real-world impact. Use quantifiable outcomes to bolster your points, as numbers provide undeniable evidence of your contributions—mirroring the analytical prowess the role requires and setting a solid foundation for your professional timeline.
- Education: Support your experience with your educational background. List your degrees, institutions, and graduation dates, highlighting coursework or certifications in data analysis or business intelligence to show your commitment to learning. Emphasize continuous learning efforts such as workshops or webinars that's complementary to formal education, illustrating your commitment to staying ahead in the ever-evolving data landscape—creating a bridge from the past to your pursuit of future excellence.
- Certifications: Round out your qualifications with certifications like Microsoft Certified: Data Analyst Associate. This demonstrates your dedication and validated expertise. Certifications can also serve as a focal point for discussion in interviews, providing a solid entryway into deeper conversations about your skills and how they align with the company’s needs—segwaying seamlessly into a section that discusses effective resume format where each element is more thoroughly explored.
Which resume format to choose
Crafting the perfect resume for a Power BI developer involves several key components that work together to make a strong impression. Start with a reverse-chronological format. This approach is essential because it effectively showcases your development in data visualization and analytics, focusing the reader’s attention on the most relevant and recent experiences first. This is particularly crucial in a tech field where cutting-edge knowledge and skills are highly valued.
When considering font, it's more than just about appearance—it's also about readability and first impressions. Choose fonts like Raleway, Exo 2, or Lato, which not only give a modern look but also enhance the readability of your resume. A well-chosen font can subtly convey professionalism and attention to detail, qualities essential for someone in a tech-driven role.
Saving your resume as a PDF isn't just a technicality; it's a best practice in resume writing. A PDF preserves your layout and design choices, ensuring that your resume looks the same on any device or software. This reliability is crucial in the competitive job market where first impressions matter, maintaining the integrity of your document as you intended.
Paying attention to margins is a small detail with a big impact. By using about 1 inch of space on all sides, you create a clean, inviting layout that makes your content more accessible. This helps prevent the document from appearing cluttered, allowing your accomplishments and skills to stand out clearly and professionally.
By thoughtfully integrating these elements, you ensure that your Power BI developer resume doesn't just tick the boxes but also tells a compelling story of your technical journey and attention to detail.
How to write a quantifiable resume experience section
To create a compelling Power BI Developer resume experience section, start by highlighting your impactful achievements and business intelligence skills. Structure this section chronologically, starting with your most recent position, so employers can quickly gauge your current expertise. Include relevant job titles and tailor your descriptions to emphasize skills and accomplishments that align with the job you’re targeting. Use action words like "developed," "optimized," and "implemented" to convey a proactive and results-driven approach. Aim to cover the last 10 to 15 years of your career to keep the information relevant. Tailoring your resume to a specific job ad involves aligning your achievements with the company’s needs, using keywords from the job description, and focusing on outcomes that demonstrate the value you brought to previous employers.
 05/2018 - 11/2023
- •Developed over 100 interactive dashboards, cutting report generation time by 40% across departments.
- •Optimized data models and queries to enhance processing speed by 30%, improving decision-making.
- •Implemented data governance protocols, boosting data accuracy and compliance by 25%.
- •Led five junior developers, conducting training sessions that raised team productivity by 20%.
This experience section stands out because it clearly demonstrates how your work added measurable value to the organization. By using specific numbers and percentages, you make your achievements easy to understand, which helps employers quickly grasp your impact. Action words like "developed," "optimized," and "implemented" help convey a proactive and skilled approach to your work. By adding leadership roles, such as mentoring a team, you add depth to your profile, showing your ability to guide others. By aligning your past achievements with the job you’re applying for, you help employers see your potential fit within their company. This focus on outcomes and alignment not only tells a compelling story but also makes your resume more appealing to hiring managers.
Technology-Focused resume experience section
A technology-focused Power BI Developer resume experience section should highlight your top achievements and skills related to data visualization and business intelligence. Begin by clearly stating your job title, place of employment, and the dates you worked there to provide context for the hiring manager. Follow with specific examples that demonstrate your ability to create impactful dashboards, collaborate with teams, and effectively utilize Power BI's capabilities. Use active verbs and industry-relevant language to emphasize your contributions, ensuring a coherent narrative throughout.
Focus on organizing your bullet points to showcase significant achievements, illustrating both your technical expertise and your ability to drive business value. Highlight measurable outcomes such as improved efficiencies, cost savings, or enhanced reporting capabilities to present a comprehensive picture of your accomplishments. Each bullet point should offer a new perspective on your skillset, covering aspects like data modeling, DAX queries, and stakeholder engagement. This cohesive approach ensures your experience section is not just informative but also compelling, clearly demonstrating your potential to make meaningful contributions to a prospective employer.
Power BI Developer
DataTech Solutions
June 2019 - September 2023
- Developed over 30 user-friendly dashboards using Power BI, enhancing decision-making processes for five major departments.
- Collaborated with cross-functional teams to deploy BI solutions that reduced reporting time by 25%.
- Leveraged DAX expressions to improve report performance and data analysis, leading to better insights into customer behavior.
- Trained over 50 employees in Power BI, boosting the technical skills of the staff and improving overall data literacy.
Project-Focused resume experience section
A project-focused Power BI Developer resume experience section should clearly demonstrate your ability to create impactful data visualization solutions. Start by outlining your responsibilities and emphasize your skills in turning raw data into actionable insights. Describe the tools and technologies you've mastered, such as DAX and Power Query, and focus on any challenges you encountered, sharing how you solved them while meeting project goals. Make sure your contributions are linked to the broader success of the projects and the organization.
Incorporate concise bullet points that showcase your achievements and the specific Power BI tools you utilized, ensuring that the outcomes are measurable and clearly articulated. Highlight improvements in decision-making processes or efficiency gains to effectively demonstrate how you managed end-to-end BI solutions. This section should convey your success in delivering crucial business intelligence insights, painting a vivid picture of your capabilities in the field.
Power BI Developer
Tech Innovations Inc.
June 2020 - Present
- Designed an interactive dashboard that made sales reports easier and faster, boosting efficiency by 30%.
- Used advanced DAX formulas to improve data analysis, enhancing clarity and insight for stakeholders.
- Collaborated actively with team members to gather requirements and ensure Power BI solutions aligned with business objectives.
- Set up automated data workflows with Power Query, which significantly reduced data preparation time by 40%.
Responsibility-Focused resume experience section
A responsibility-focused Power BI developer resume experience section should concentrate on showcasing your core skills and the impact of your work. Start by listing your work dates and title to define your role clearly. Follow this with specific responsibilities, such as developing data models and dashboards, which demonstrate your technical abilities. Highlight how your collaboration with teams improved processes, showing your ability to work well with others. Quantify achievements, such as efficiency boosts, to underscore the tangible value you added to your past roles.
Each bullet point should flow naturally from one to the next, illustrating a comprehensive picture of your skills. Mention the tools you've mastered, like SQL or DAX, to highlight specialized knowledge. Contextualize your work within your employer's industry to demonstrate your adaptability and breadth of experience. This approach helps potential employers see the continuous impact you can have in their organization.
Power BI Developer
DataTech Solutions
June 2020 - August 2023
- Developed over 20 interactive Power BI dashboards, significantly enhancing data visualization and decision-making across departments.
- Collaborated effectively with cross-functional teams, successfully gathering requirements and delivering tailored solutions that boosted reporting efficiency by 30%.
- Optimized DAX queries to improve the performance of existing BI reports, reducing load times by 40% and ensuring faster access to critical data.
- Conducted training sessions for over 50 staff members on Power BI tools and best practices, noticeably increasing overall team proficiency.
Efficiency-Focused resume experience section
An efficiency-focused Power BI developer resume experience section should highlight your role in boosting productivity and streamlining processes. Begin by ensuring your job titles and roles effectively convey your expertise in enhancing efficiency. Use action-oriented language to connect your specific accomplishments with the overall impact, such as shortening report creation times, enhancing data accessibility, or aiding quicker decision-making. By organizing bullet points, you can clearly demonstrate tangible outcomes like faster data analyses and more efficient dashboards.
When discussing your projects, emphasize how your efforts have driven efficiency and include metrics or results that illustrate tangible improvements. For instance, consider how cutting downtime or speeding up information delivery has benefited past projects. Tailor your descriptions to match the efficiency objectives of the positions you're aiming for, making sure they align with potential employers' goals. Maintain a concise and straightforward flow, ensuring each sentence smoothly highlights your ability to seamlessly optimize business intelligence solutions.
Power BI Developer
Tech Solutions Inc.
June 2020 - Present
- Reduced report generation time by 40% through automated data processing workflows.
- Optimized dashboard design, leading to a 25% faster load time.
- Implemented a centralized data repository which improved data retrieval speed by 30%.
- Developed custom visuals, enhancing user insight into key performance metrics by 20%.
Write your Power BI developer resume summary section
A Power BI-focused resume summary should clearly convey your strengths and the unique value you bring to potential employers. If you have a wealth of experience, an effective resume summary can highlight your key skills, achievements, and career highlights in a succinct manner. By using strong action verbs and providing concrete examples, you can effectively communicate your expertise.
Here's a closely related example for a Power BI Developer:
Your resume summary should highlight not only your technical skills but also your most notable achievements, providing a clear and quantifiable measure of your prior successes. This results-driven approach adds value for potential employers, showing them what impact you can have on their organization.
To describe yourself effectively in a resume, it's important to understand and communicate what sets you apart from others. Use powerful and concise language, ensuring that every sentence adds value and is relevant to the job description.
A resume summary differs from an objective or profile statement. While an objective expresses your career goals and is ideal for entry-level applications, a profile offers a broader view of your work style and history. Meanwhile, a summary of qualifications typically lists key achievements in bullet points.
Each of these sections has its place, but knowing the distinction helps tailor your resume to the specific role. As a seasoned professional, a resume summary is effective in showcasing your ability to meet a prospective employer's needs. Through thoughtful presentation, each part of your resume should work together to position you as the best candidate for the job.
Listing your Power BI developer skills on your resume
A Power BI Developer-focused resume should effectively present both your hard and soft skills to make a compelling case to potential employers. Hard skills, like data modeling and software expertise, demonstrate your technical prowess, while soft skills such as communication and problem-solving highlight your ability to work well with others. Including these skills in their own section or integrating them into your experience and summary can create a cohesive narrative that showcases the full spectrum of your abilities.
Moreover, skills and strengths serve as resume keywords, which are crucial for catching the attention of hiring managers and applicant tracking systems. By using the right keywords, you increase your chances of standing out.
Below is an example of how to display your skills effectively:
This format clearly outlines relevant skills, making it easy for hiring managers and systems to identify what you bring to the table. Including terms like "SQL" and "Data Visualization" specifically highlights your expertise and improves your resume’s searchability through keyword filters.
Best hard skills to feature on your power bi developer resume
For a Power BI Developer, strong hard skills are essential to show you can handle technical tasks efficiently. They communicate your capability with data analysis and reporting.
Hard Skills
- Data Modeling
- DAX (Data Analysis Expressions)
- Power Query
- SQL
- ETL Processes
- Dashboard Creation
- Report Design
- Data Visualization
- R Programming
- Integration Services
- Azure Analytics
- Python
- Performance Optimization
- Database Management
- Business Intelligence Tools
Best soft skills to feature on your power bi developer resume
Equally important are the soft skills, which describe how well you collaborate and manage challenges in your role.
By strategically organizing your skills, you're not just listing qualifications — you're telling a story of your professional journey and potential as a Power BI Developer.
Soft Skills
- Communication
- Problem-solving
- Team Collaboration
- Analytical Thinking
- Time Management
- Adaptability
- Attention to Detail
- Creativity
- Critical Thinking
- Decision-making
- Self-Motivation
- Conflict Resolution
- Leadership
- Flexibility
- Strategic Thinking
How to include your education on your resume
An education section is an essential part of a Power BI developer resume. It gives potential employers insight into your academic background and relevant skills. This section should be tailored to the job you’re applying for. Only include education that is pertinent to being a Power BI developer. Unrelated coursework or degrees don’t need to make the cut.
If you excelled academically, including your GPA can be a plus. The GPA should be listed out of a 4.0 scale like this: 3.8/4.0. If you graduated with honors like cum laude, include this as well, as it highlights your dedication and hard work. When listing your degree, specify the exact title, which in this case could be something like "Bachelor of Science in Information Technology."
Here’s a wrong example of an education section:
09/2015 - 05/2017 And here’s the right example:
08/2017 - 05/2021 The second example is effective because it showcases a relevant degree and strong academic performance. The degree explicitly relates to the technology field, a vital aspect for a Power BI developer role. The 3.8 GPA out of 4.0 demonstrates academic achievement, further strengthening your candidacy. Ensuring your education section is purposeful and well-structured adds significant substance to your resume.
How to include Power BI developer certificates on your resume
Including a certificates section in your Power BI developer resume is essential. It showcases your expertise and commitment to professional growth. List the name of each certification prominently. Include the date when you earned the certification. Add the issuing organization to validate the certificate. Certificates can also be displayed in the header to catch the recruiter's eye early.
Here is a JSON example of a standalone certificates section:
This example is good because it lists relevant certificates for a Power BI developer. It includes well-known and reputable organizations like Microsoft and LinkedIn Learning. Such certificates highlight your data analysis skills and Power BI proficiency. The clarity and layout make it easy for recruiters to quickly verify your qualifications. Including the certificates section ensures that your resume stands out and underscores your dedication to staying current in your field.
Extra sections to include in your Power BI developer resume
In today's competitive job market, a well-crafted resume can make all the difference, especially for specialized roles such as a Power BI developer. Adding certain sections to your resume not only provides a holistic view of your professional life but also offers insight into your personal skills and interests. These sections, while often overlooked, can distinguish you from other candidates.
- Language section — Demonstrate your multilingual capabilities to show retention skills and cultural adaptability, which can be useful in diverse work environments.
- Hobbies and interests section — Showcase activities that highlight your analytical thinking or technological curiosity, conveying personal attributes that align with your role.
- Volunteer work section — Illustrate your community involvement, which reflects team spirit and a proactive work ethic valued in collaborative environments.
- Books section — List relevant technical or business publications you've read to show continuous learning and a passion for industry trends.
Incorporating these sections thoughtfully helps you present a well-rounded profile that can impress potential employers. Each addition provides key insights that support your qualifications as a proficient and dynamic Power BI developer.
In Conclusion
In conclusion, crafting an impressive Power BI developer resume is crucial in securing your dream job. Presenting your technical skills and achievements in a clear and concise format can set you apart in a competitive market. A well-organized resume not only highlights your proficiency with Power BI tools but also showcases your ability to turn complex data into actionable insights. Use a reverse-chronological order to emphasize your most recent accomplishments, ensuring that your resume reflects both your technical and soft skills. Moreover, integrating quantifiable results and specific examples of your work underscores your direct impact on business outcomes. Don’t forget to include your education, relevant certifications, and any unique sections that reflect your personal attributes and interests. Remember, each component of your resume should work together to convey your readiness for the role, emphasizing both your analytical capabilities and your commitment to continuous learning. When combined, these elements will help you make a compelling case for why you’re an ideal candidate, turning your resume into a powerful personal billboard.
Related Articles

Continue Reading
Check more recommended readings to get the job of your dreams.
Resume
Resources
Tools
© 2026. All rights reserved.
Made with love by people who care.