Tableau Developer Resume Examples

Aug 27, 2024
|
12 min read
Master the art of creating a winning tableau developer resume with our simple, step-by-step guide. Get noticed and land your dream job in data visualization today!
Rated by 348 people
- •Developed over 20 operational risk dashboards, enhancing real-time risk assessment and executive decision-making.
- •Streamlined data upload processes by implementing ETL pipelines, reducing data preparation time by 30%.
- •Collaborated with business analysts to translate reporting requirements, leading to a 15% improvement in report accuracy.
- •Managed Tableau Server deployments and upgrades, resulting in a 25% increase in server performance and reliability.
- •Provided training and support to over 50 end-users, ensuring seamless integration and usage of dashboards.
- •Engaged with cross-functional teams to drive automation projects, reducing manual reporting efforts by 40%.
- •Designed and deployed compliance risk dashboards, supporting regulatory reporting and internal audits.
- •Interfaced with data owners to create connections for 10+ compliance risk data sets.
- •Conducted data analysis to identify trends in past business performance, improving predictive analytics by 20%.
- •Implemented robust internal controls ensuring audit-readiness and accuracy for all produced reports.
- •Engaged with multiple lines of defense stakeholders to proactively manage operational risk indicators.
- •Produced clear and concise executive-level reporting, allowing senior management to make informed business decisions rapidly.
- •Identified and analyzed data patterns, providing insights that led to a 15% decrease in operational losses.
- •Developed future-looking reports to help the management team plan for financial quarters ahead.
- •Ensured the efficiency of existing reports and pursued continuous improvements resulting in a 10% increase in reporting accuracy.
- •Developed and maintained compliance risk dashboards used for regulatory and executive-level reporting.
- •Facilitated successful SDLC deployments in partnership with the technology team, improving project delivery times by 20%.
- •Managed timelines for multiple projects, consistently delivering on or ahead of schedule with minimal supervision.
- •Worked closely with end-users to gather feedback and make necessary iterations, resulting in a 25% increase in user satisfaction.

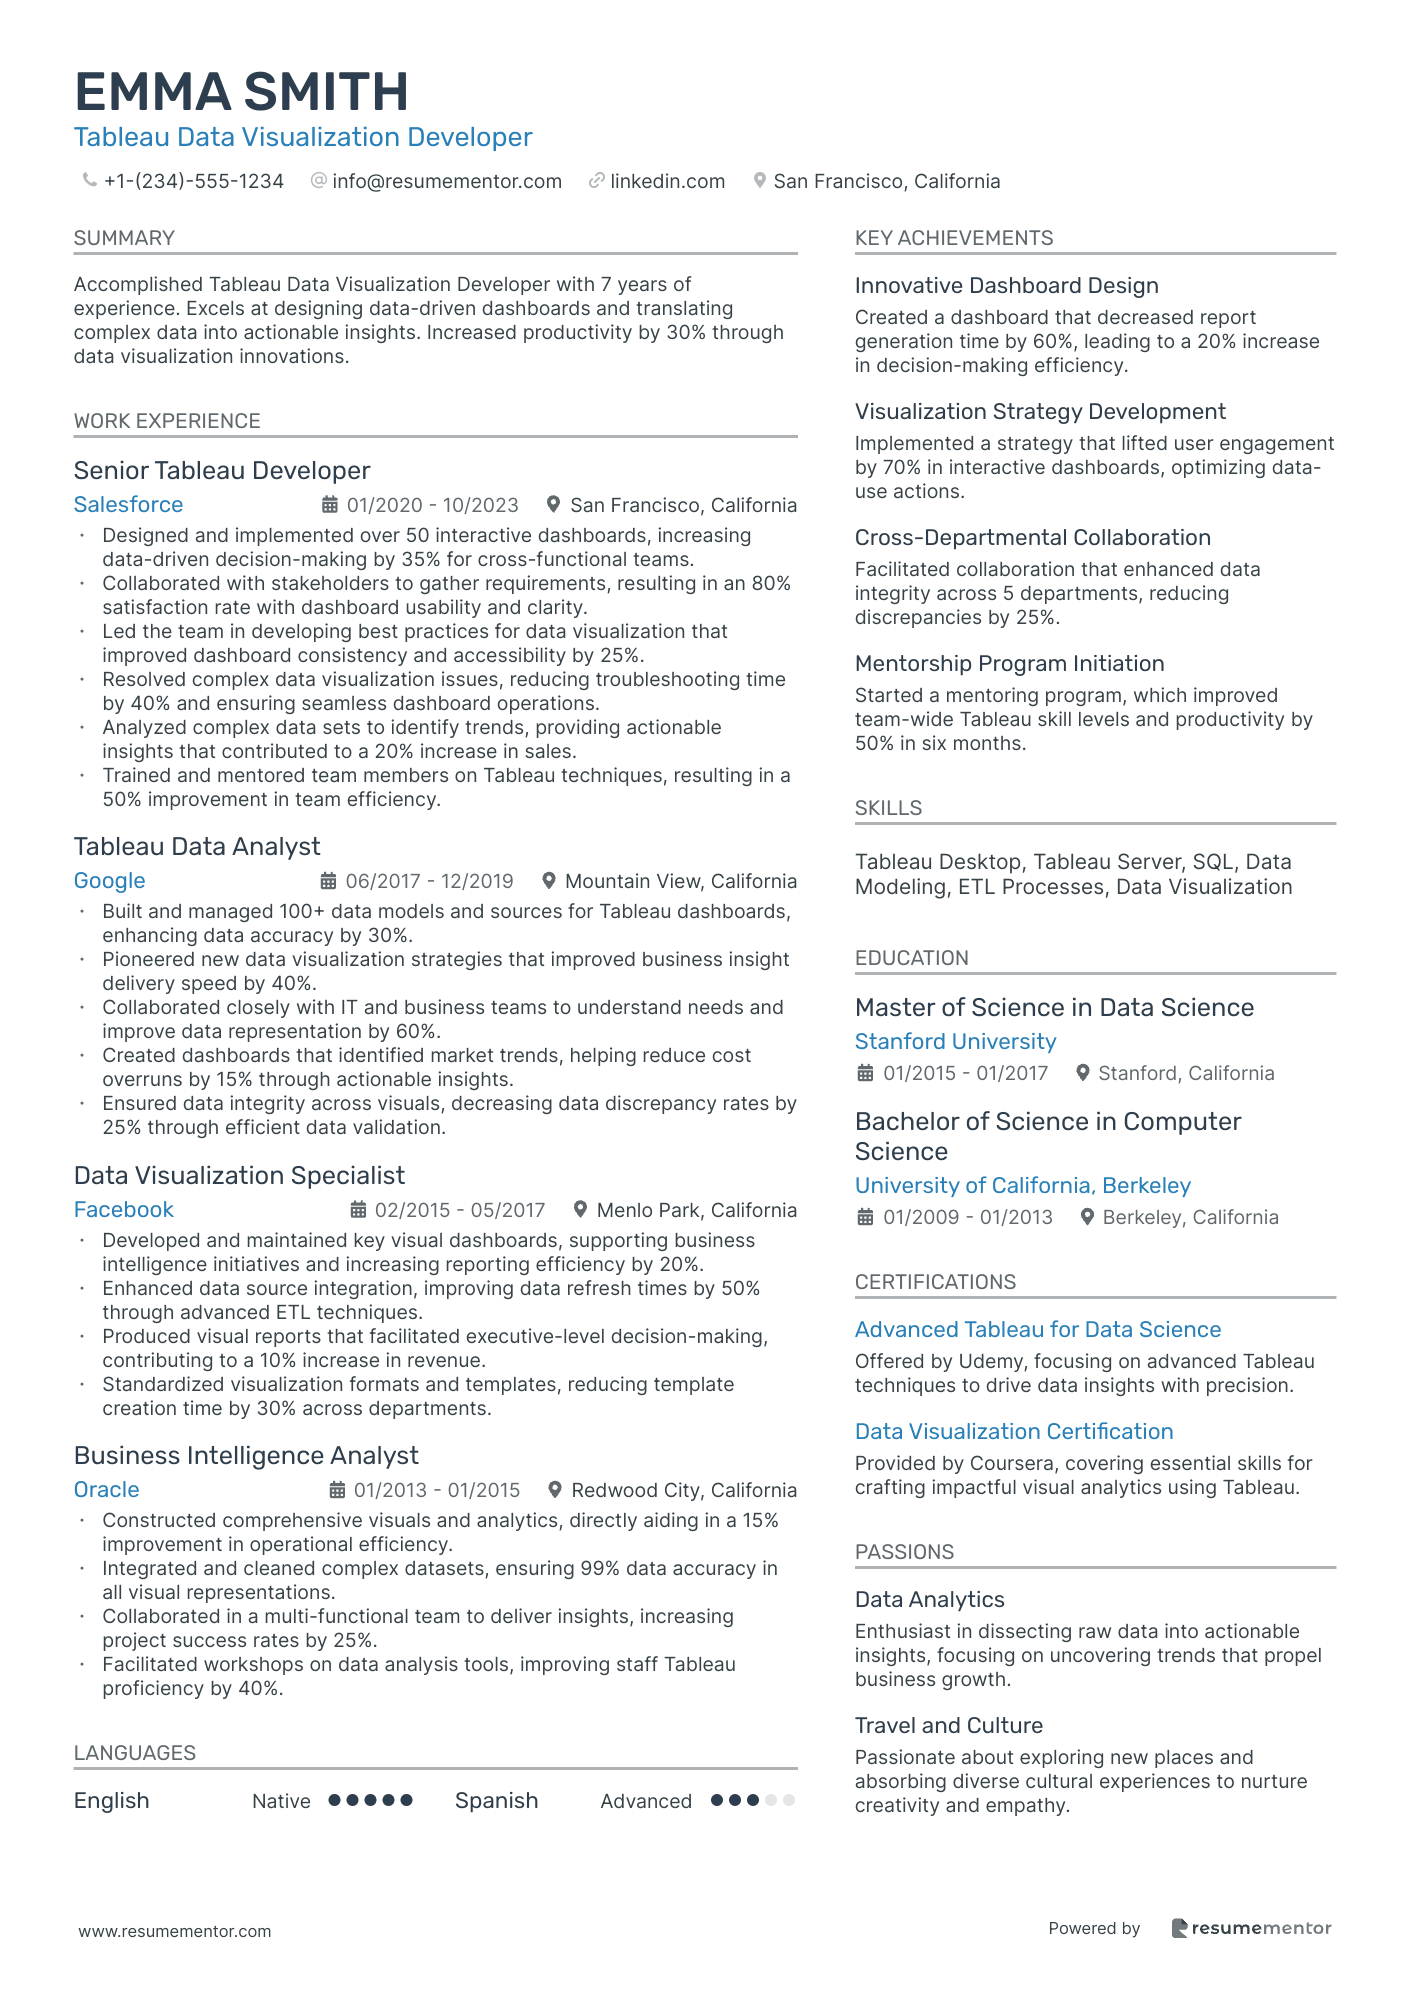
Tableau Data Visualization Developer
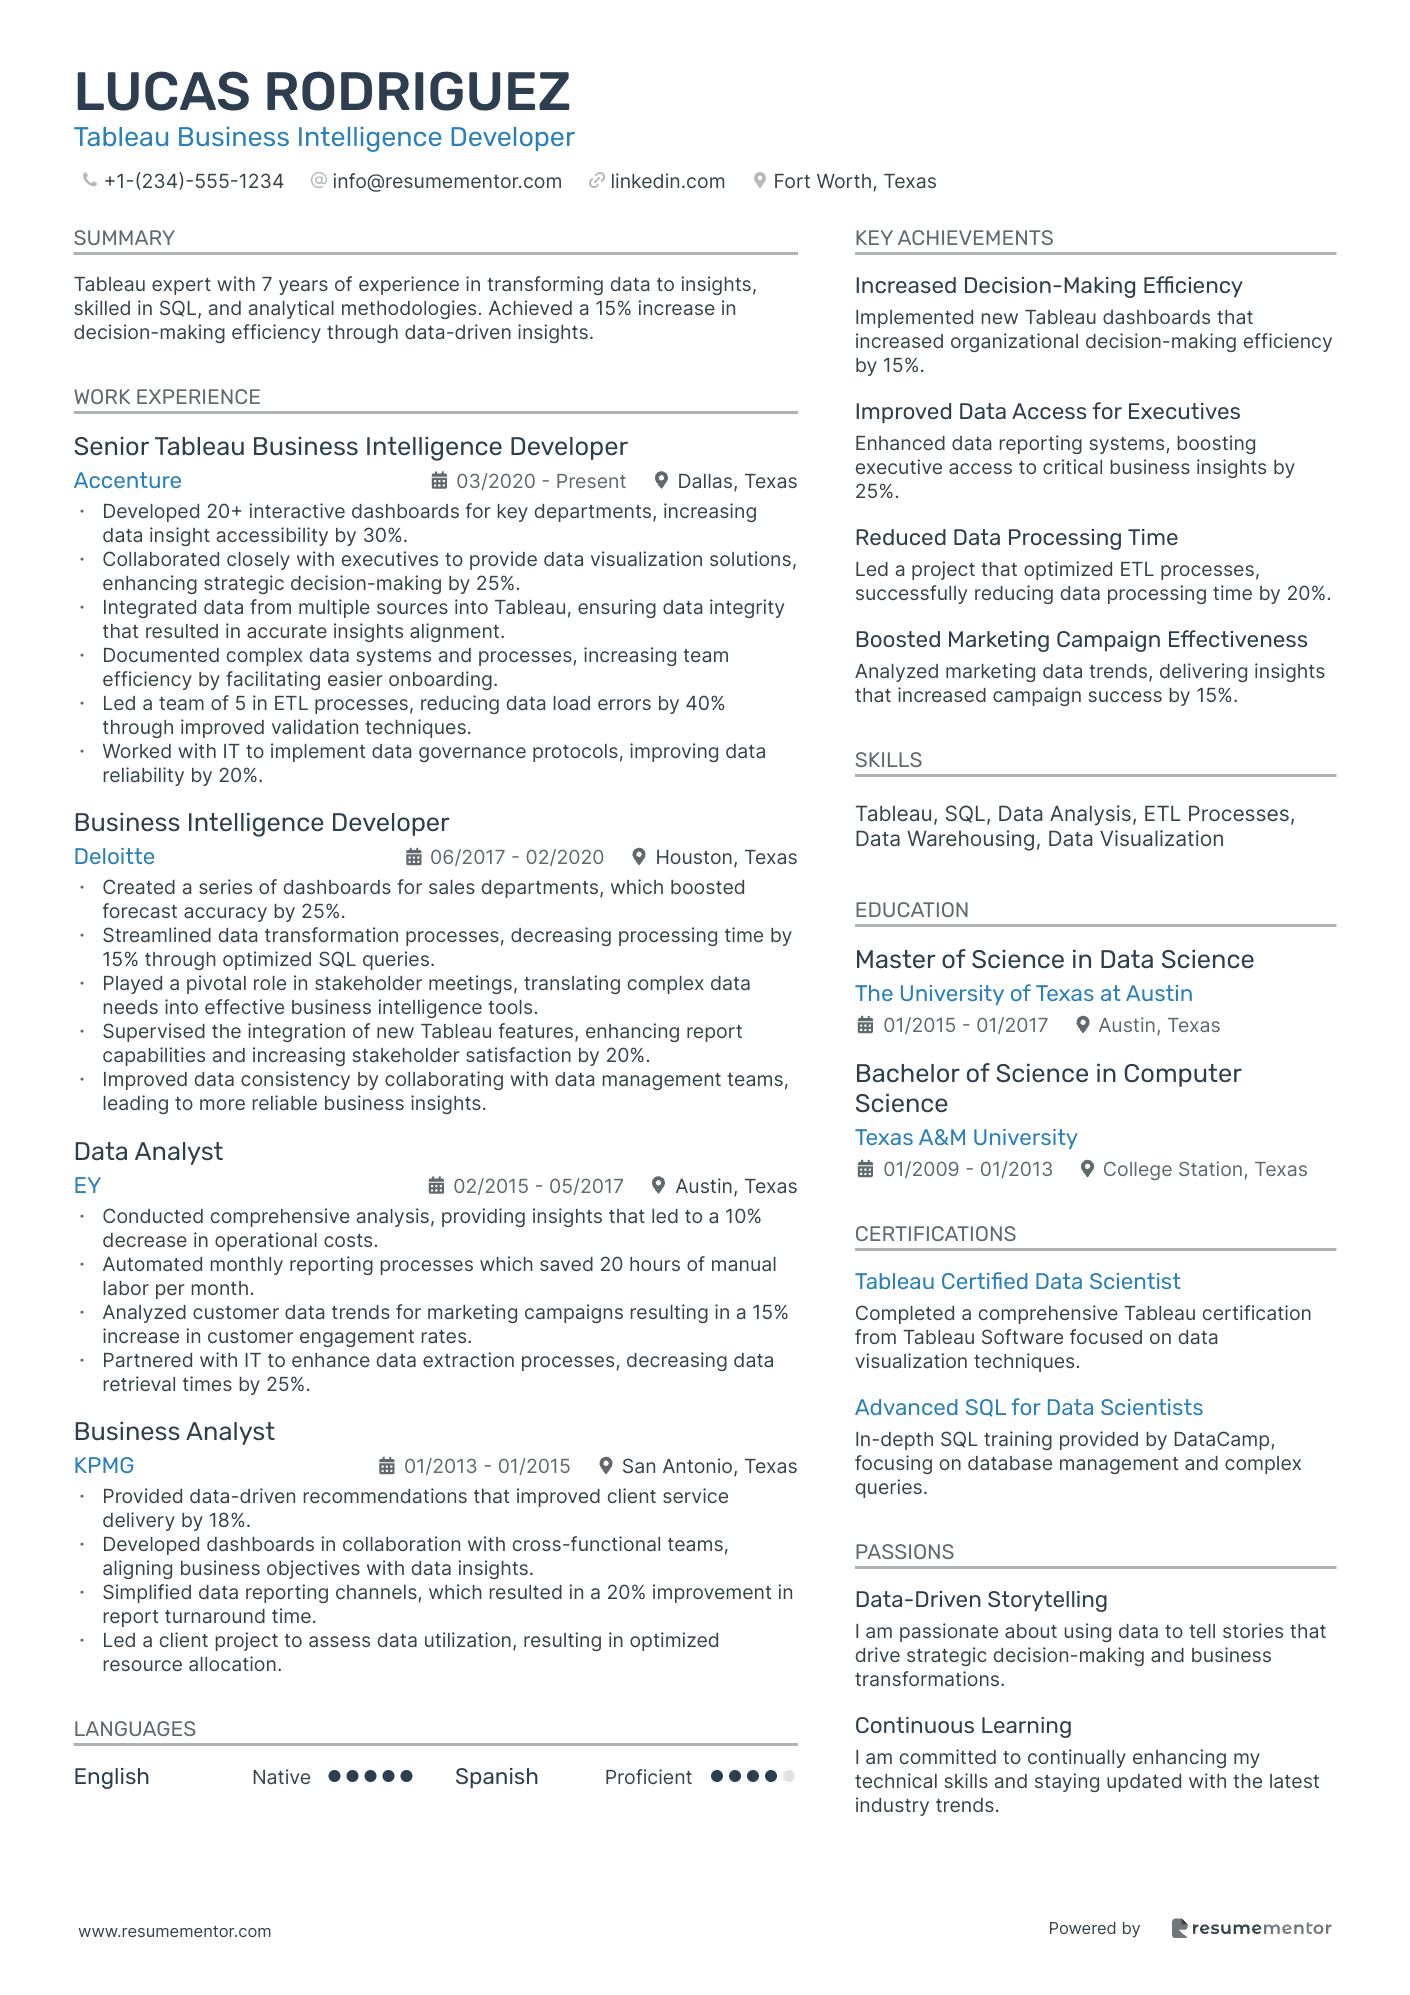
Tableau Business Intelligence Developer
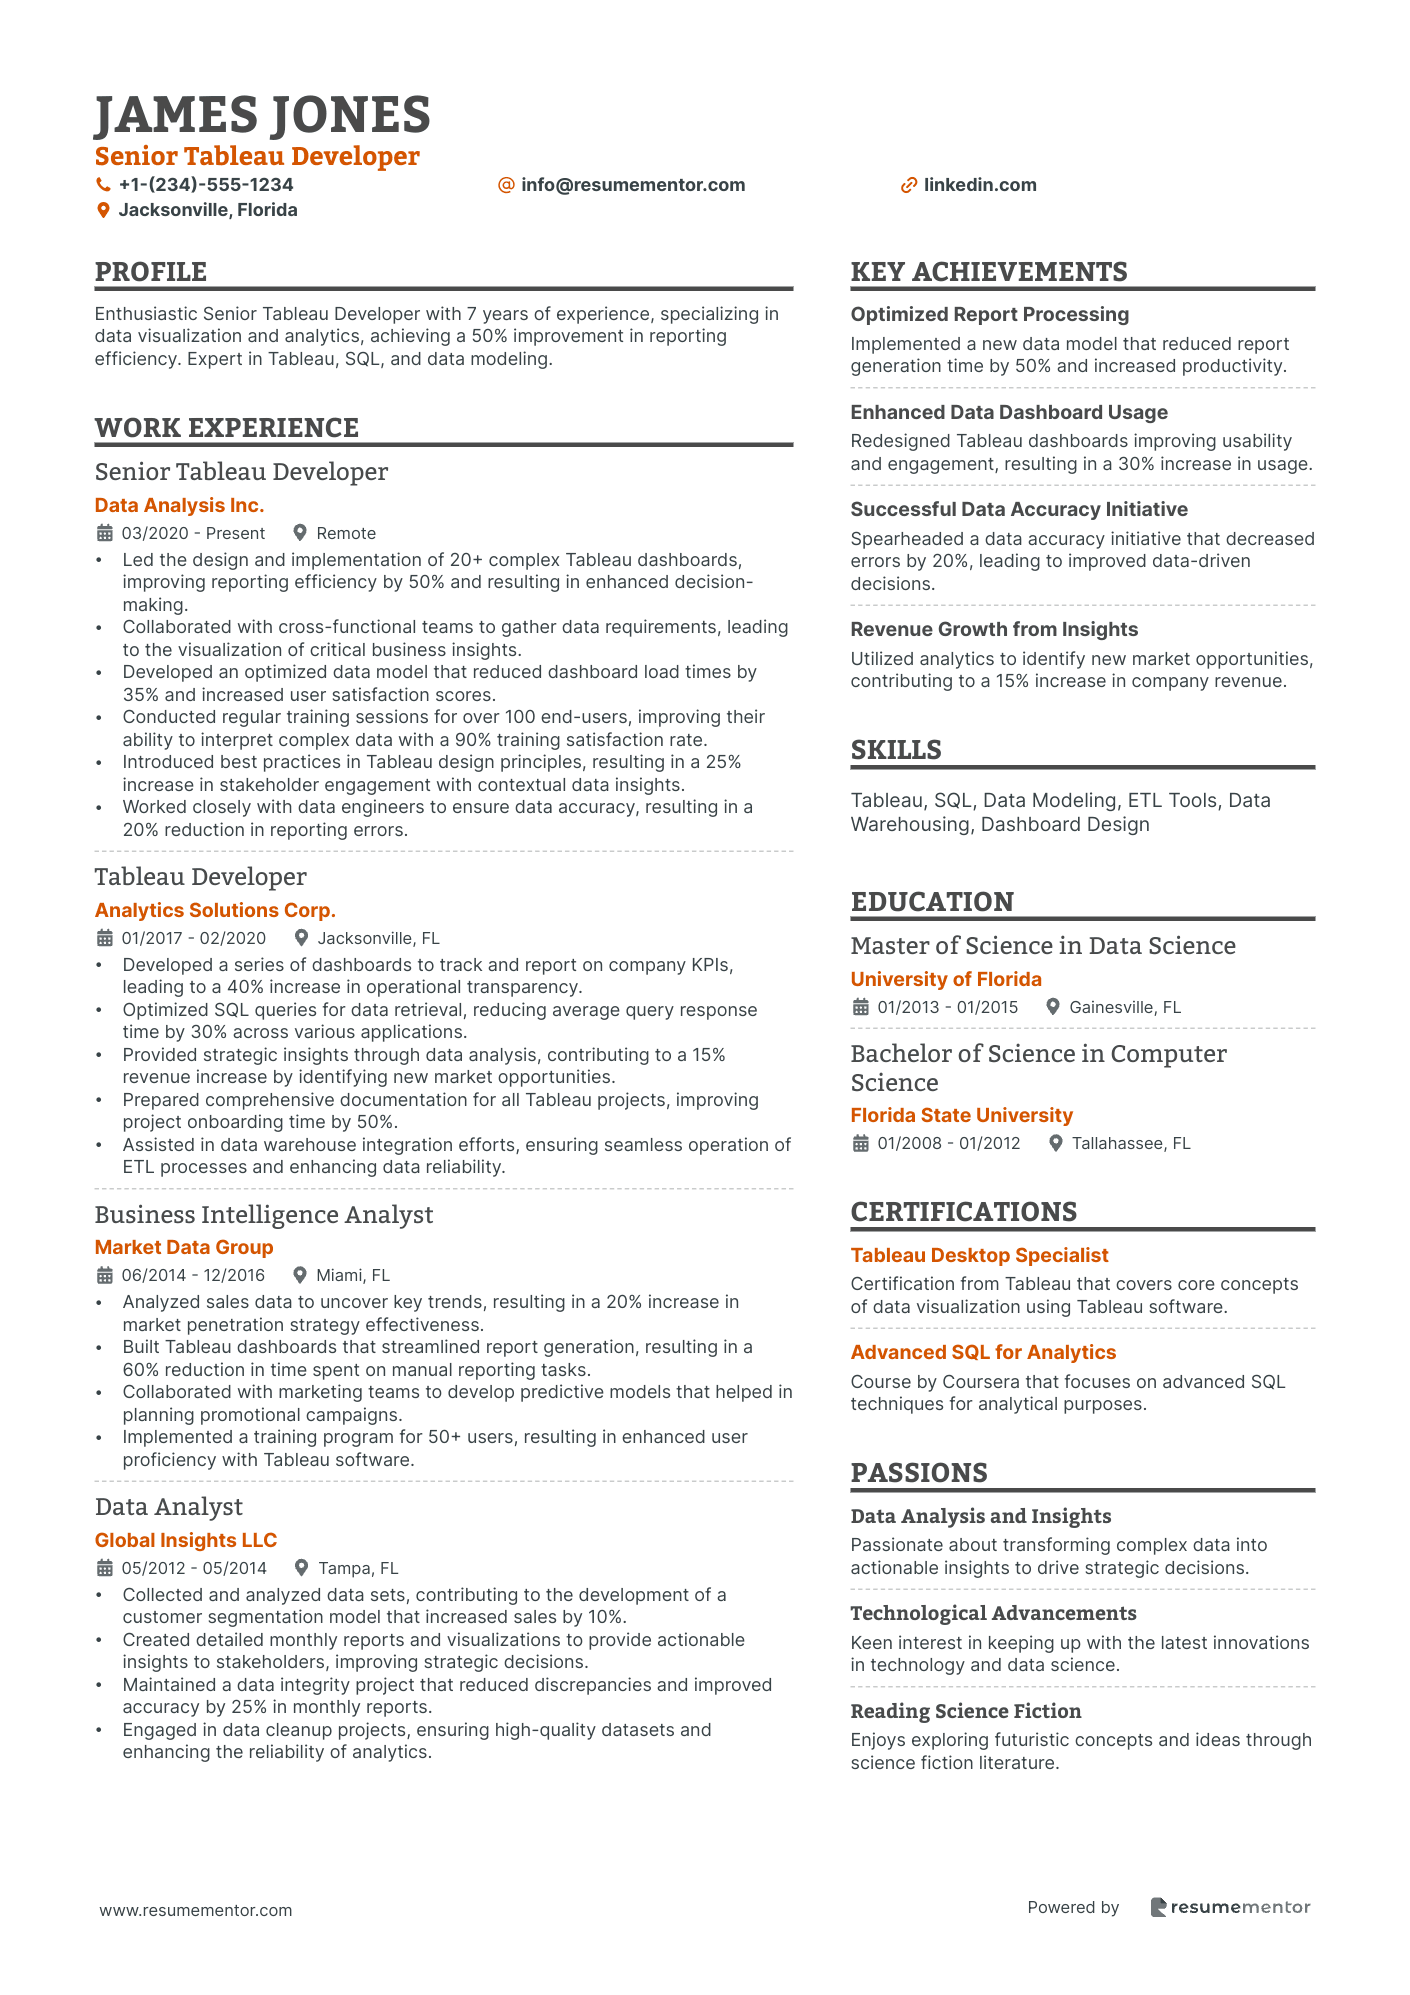
Senior Tableau Developer
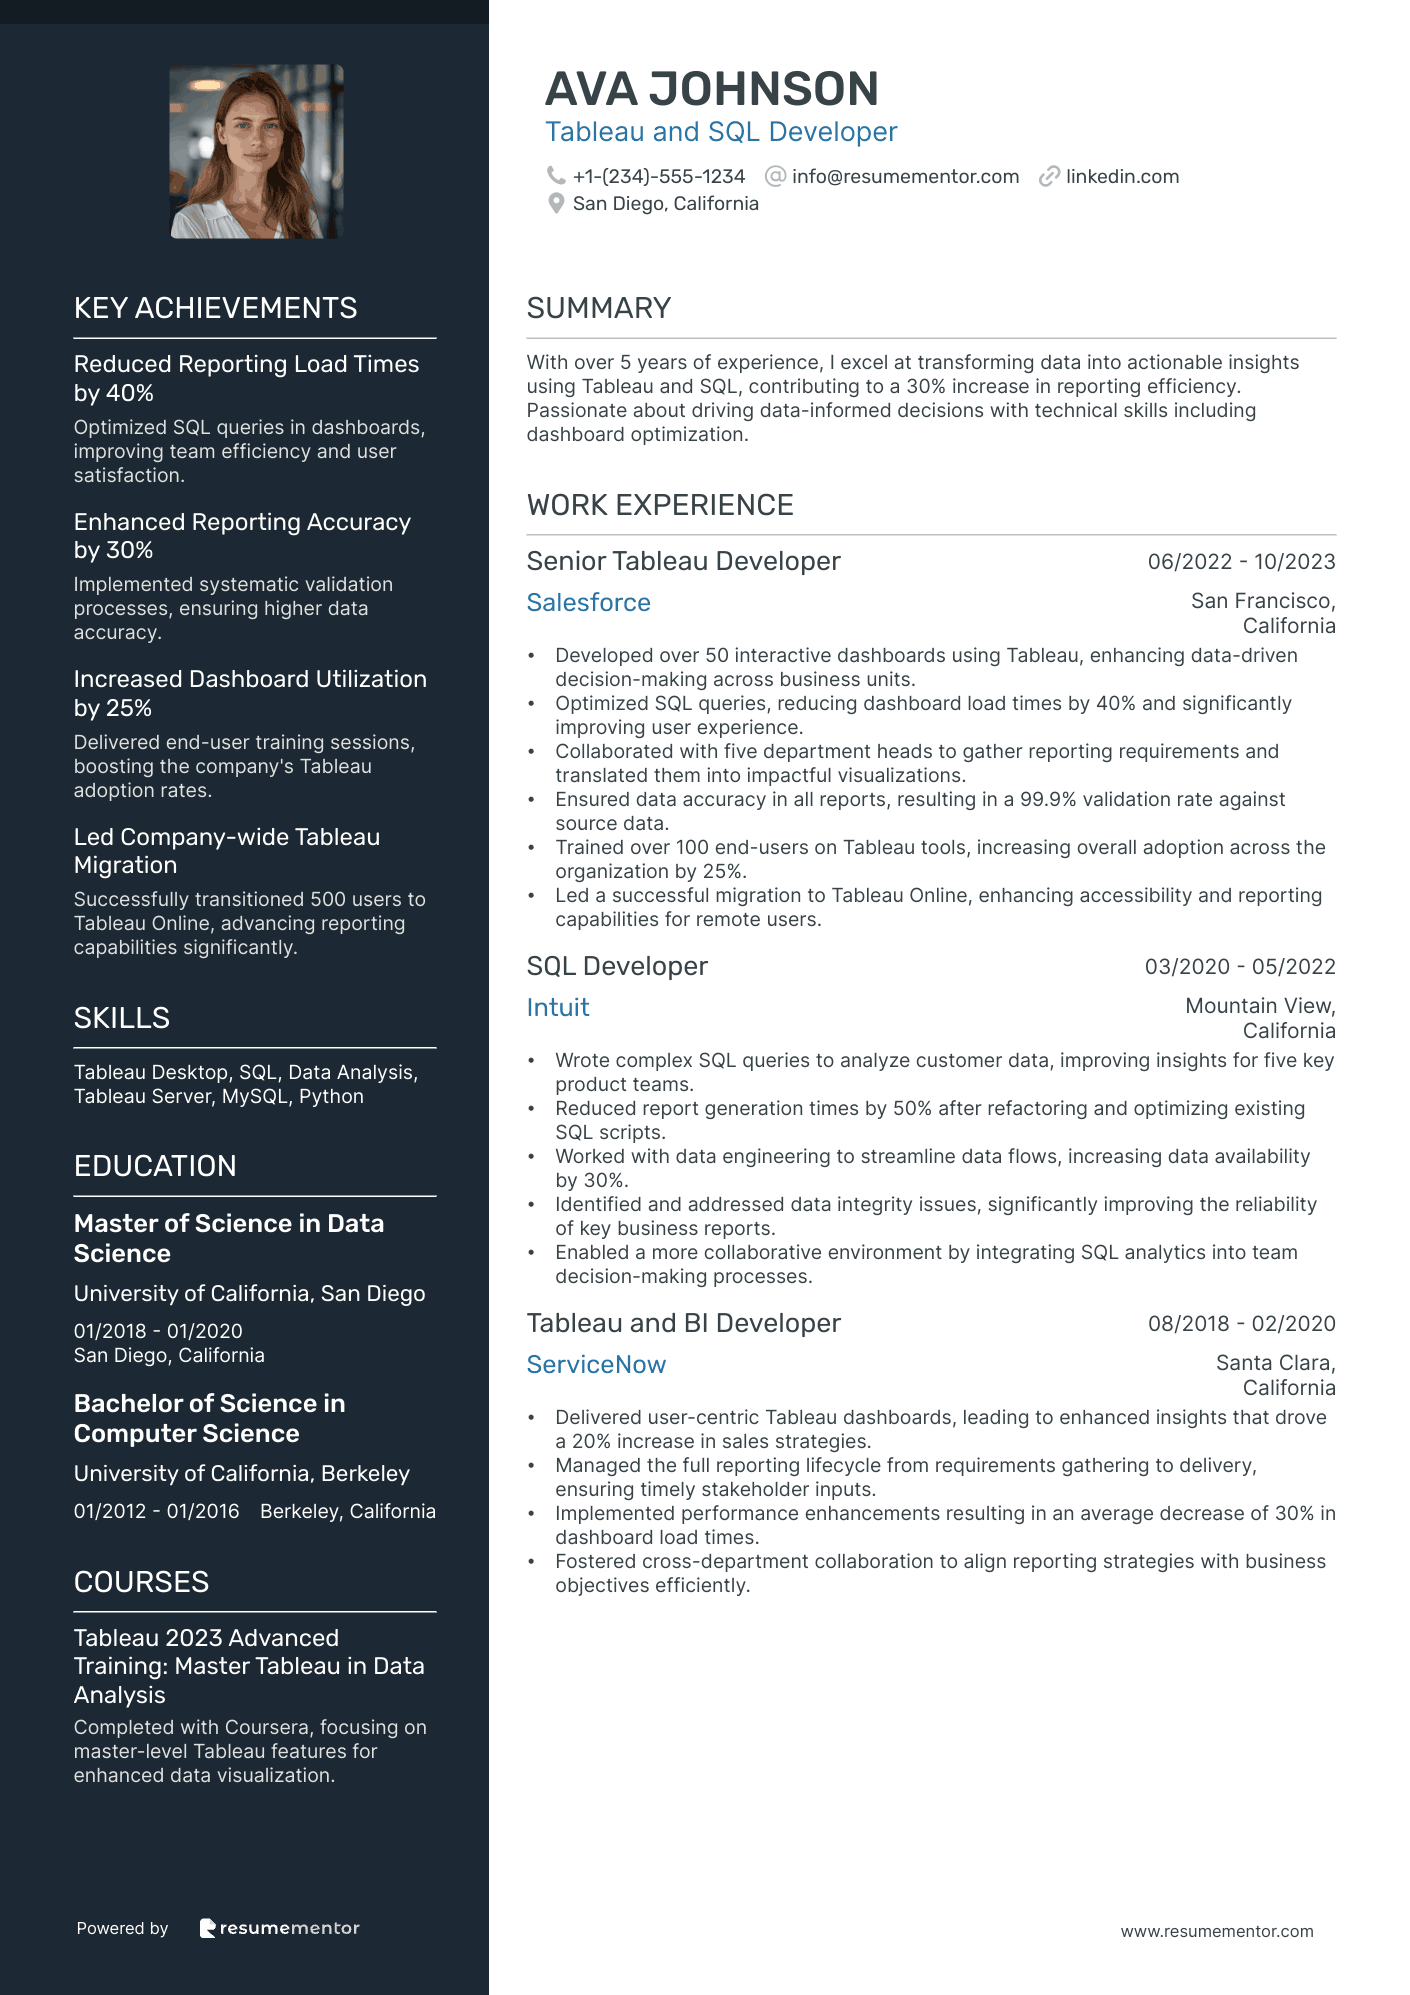
Tableau and SQL Developer
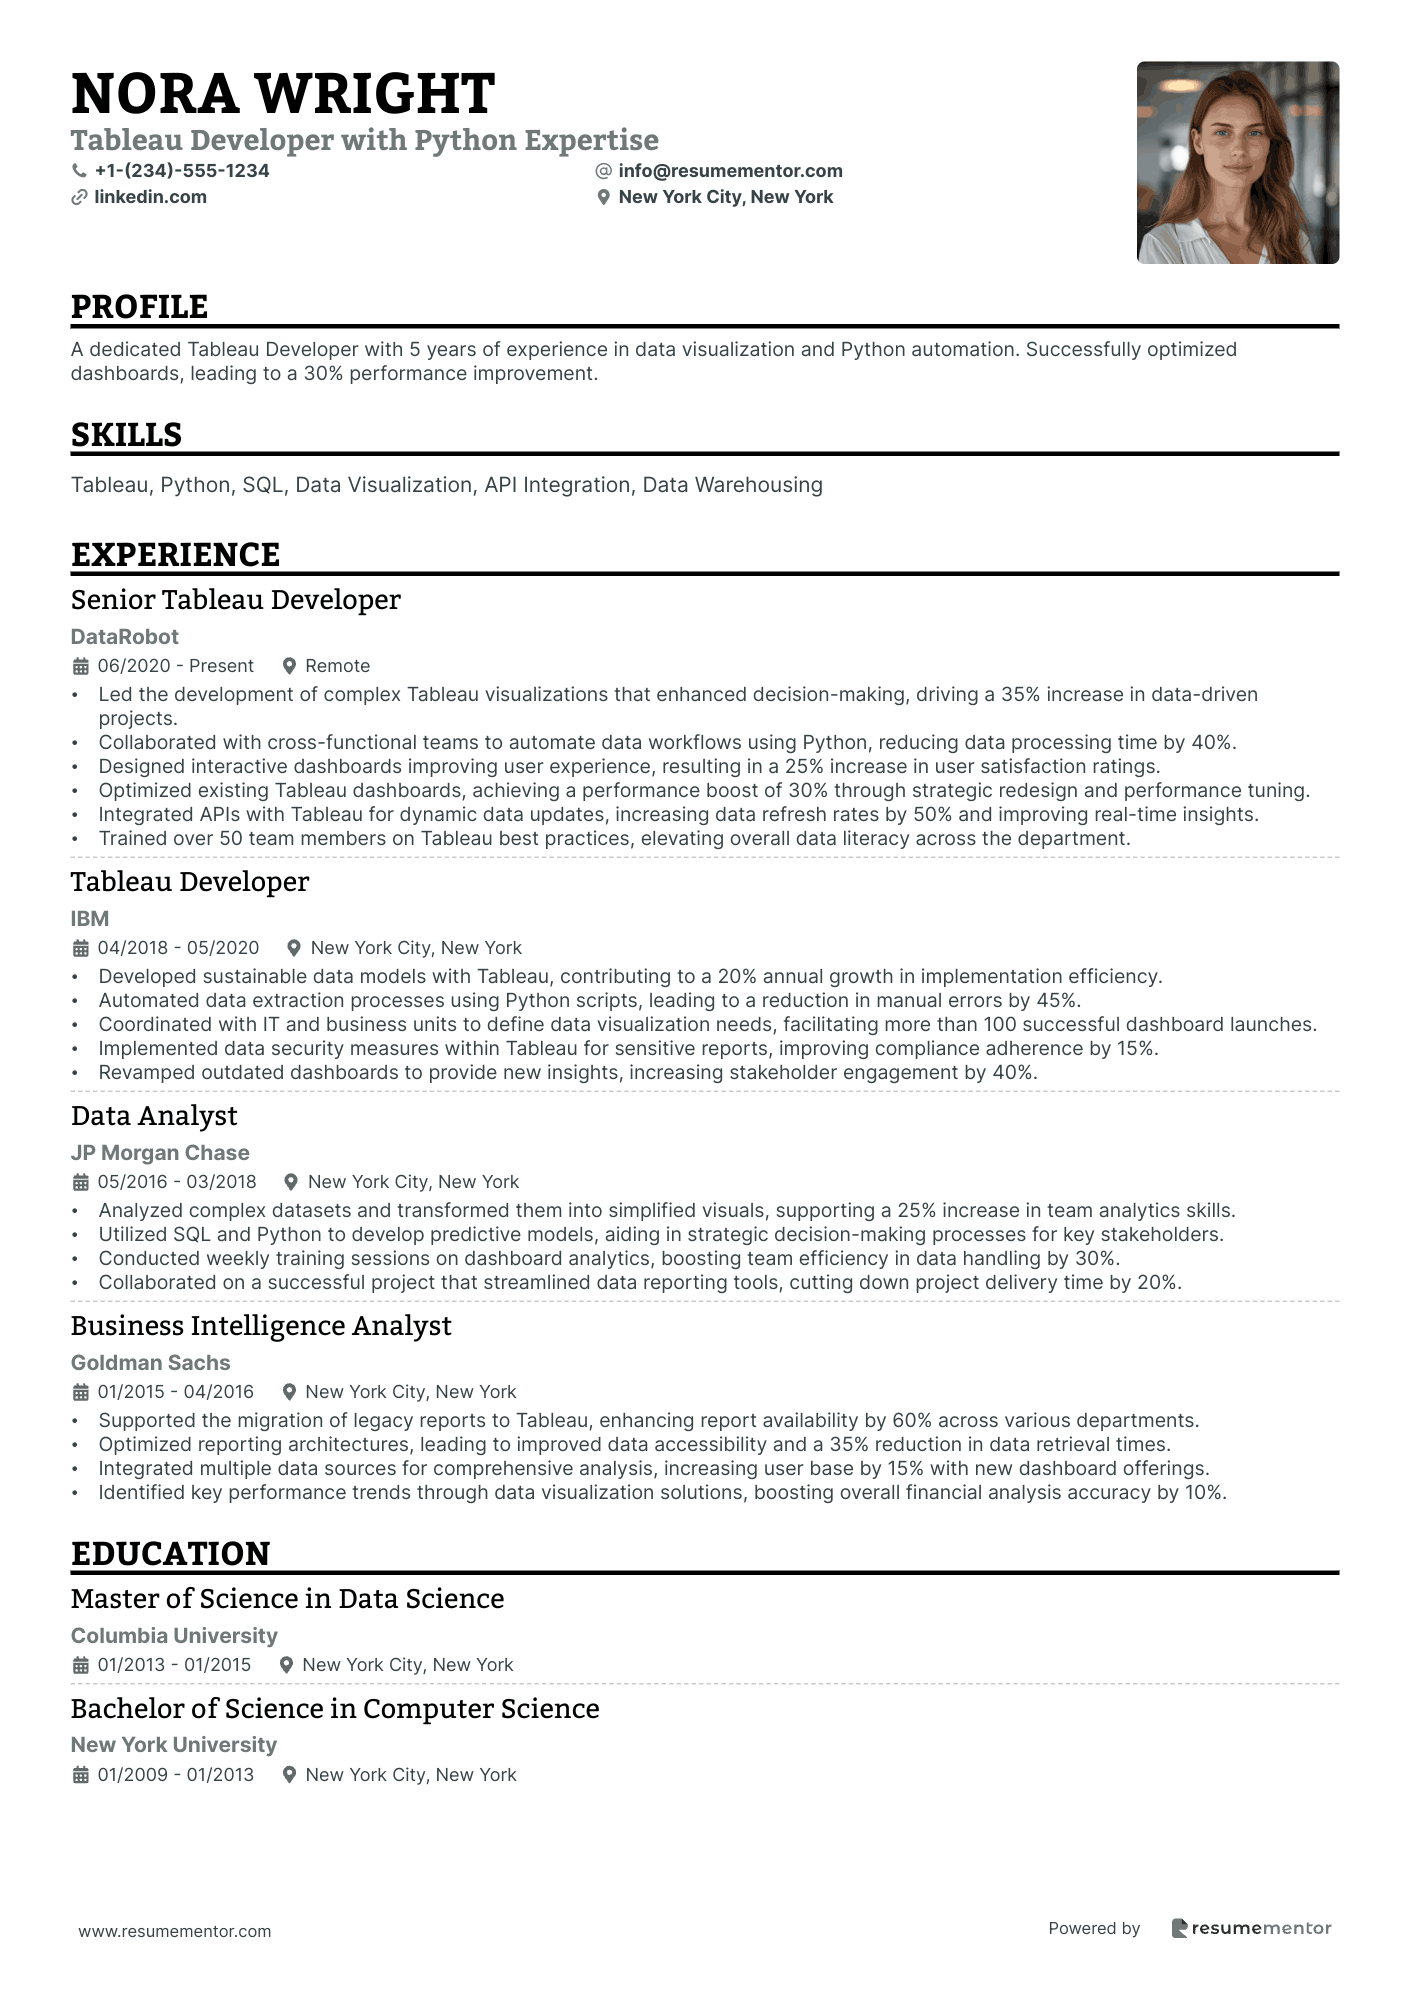
Tableau Developer with Python Expertise
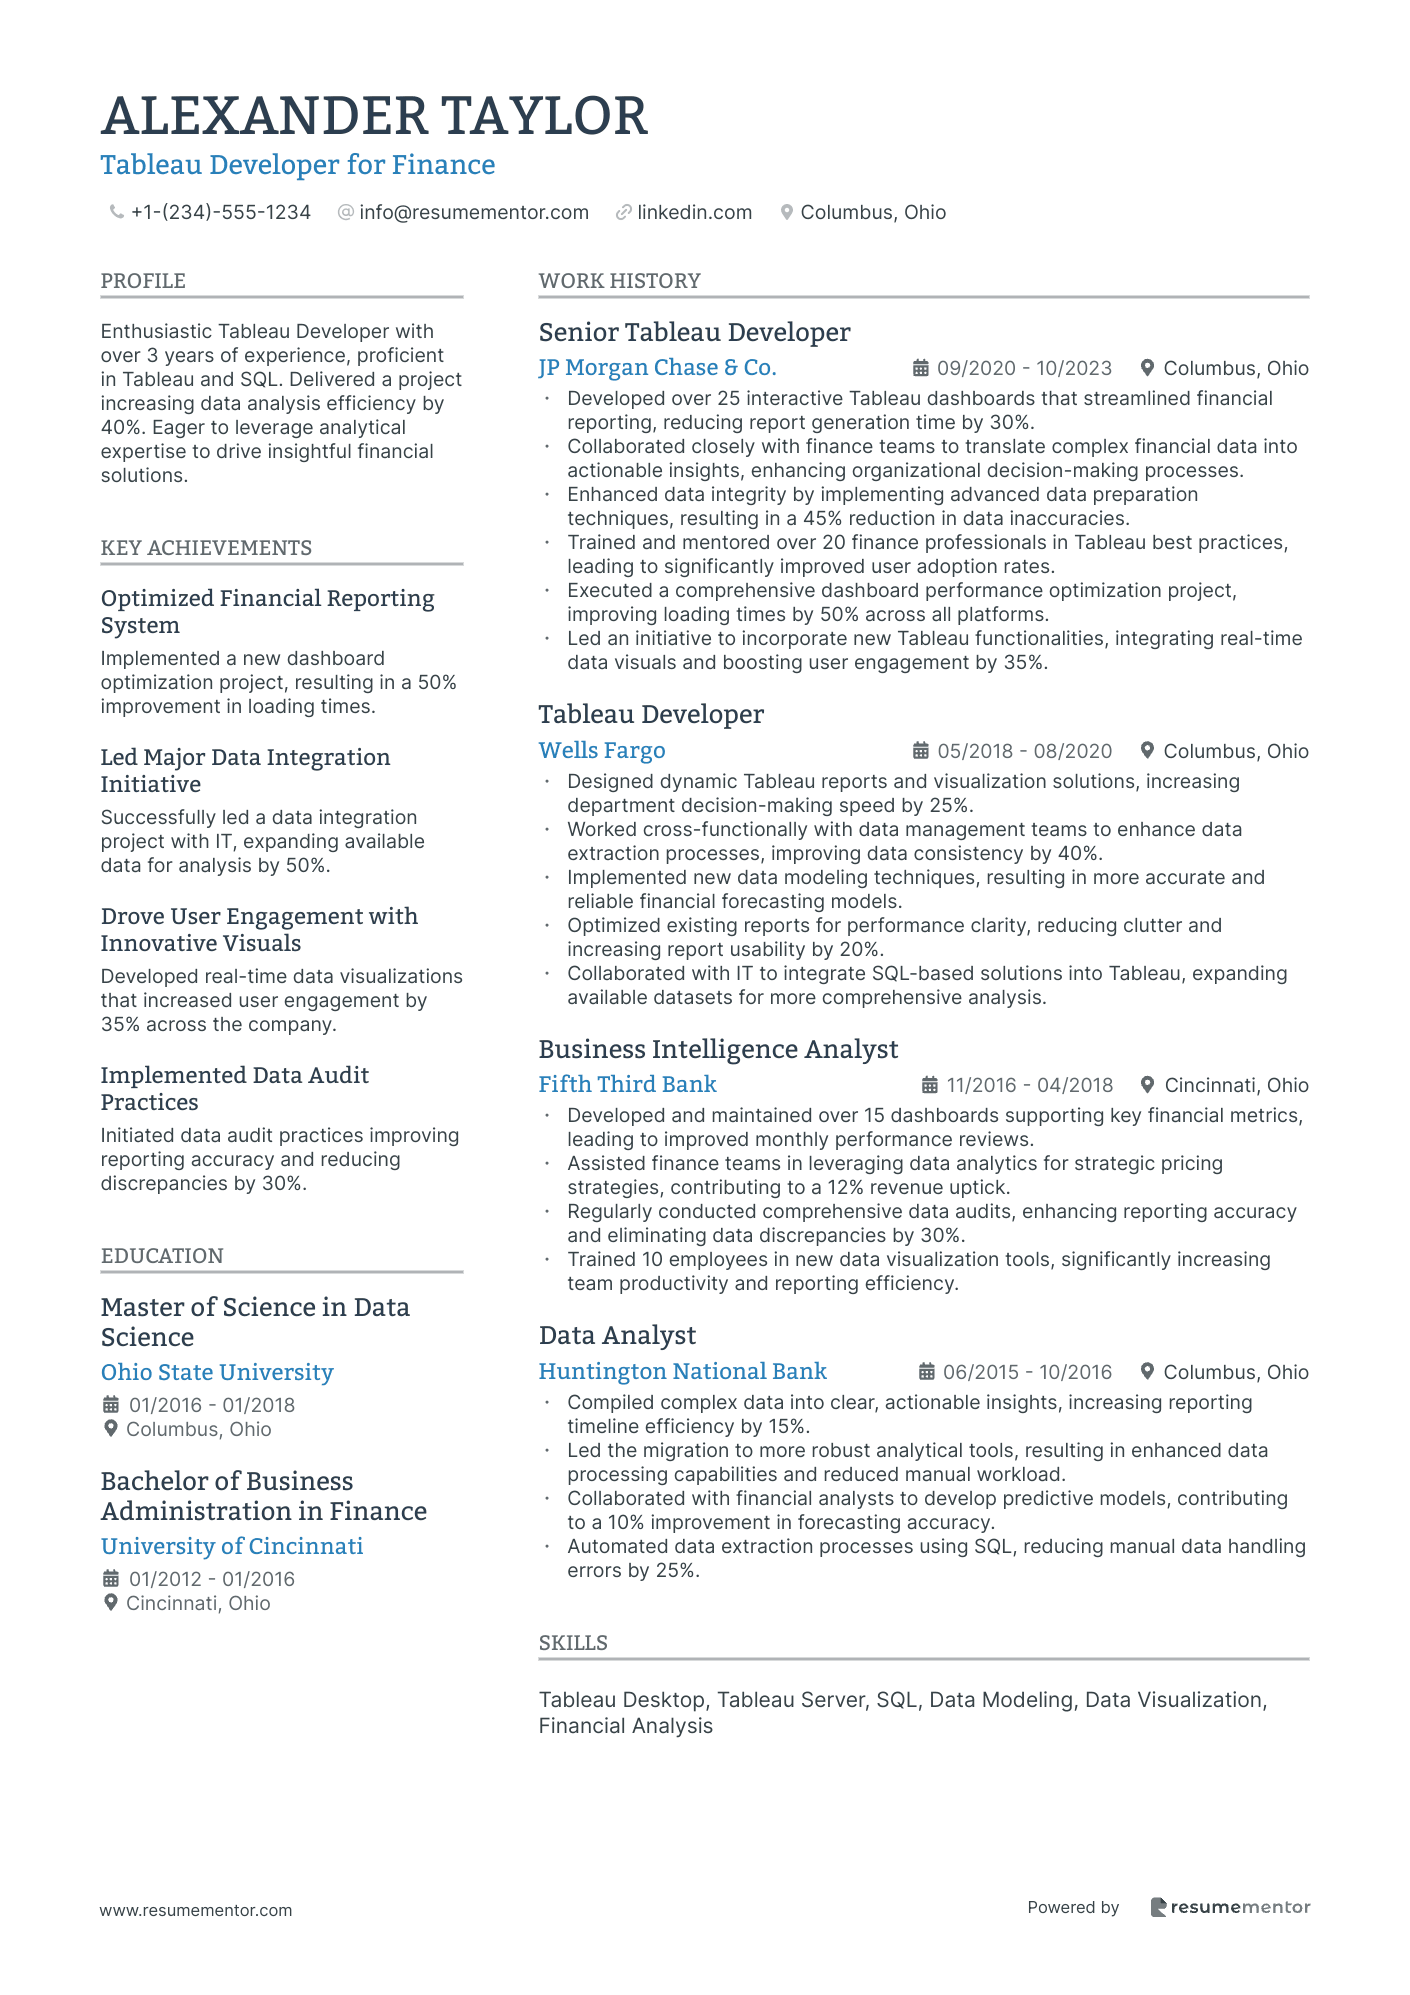
Tableau Developer for Finance
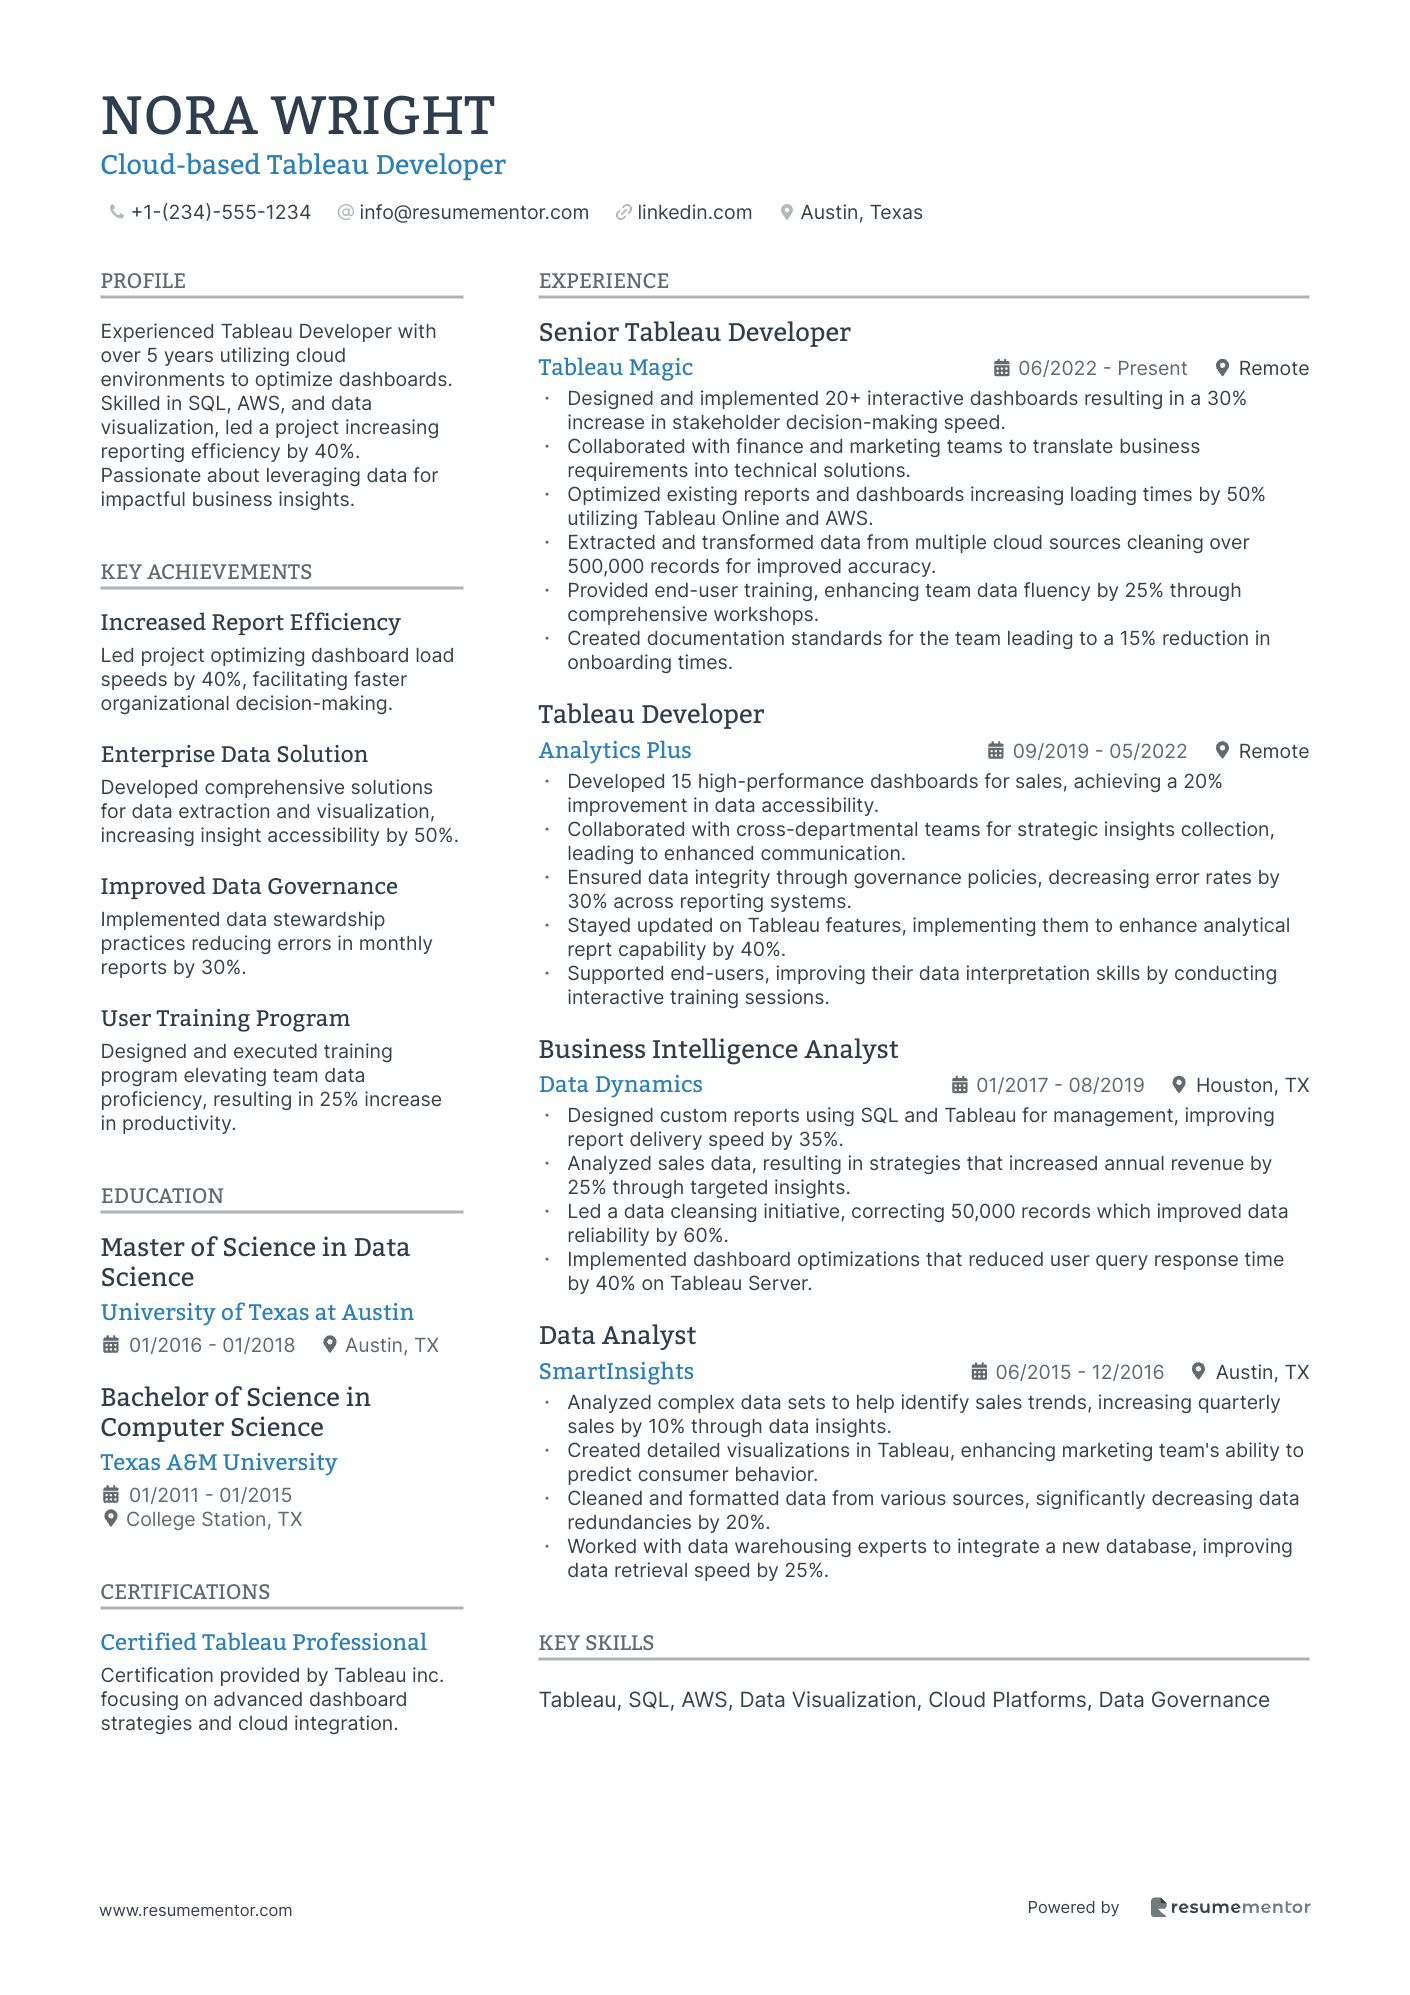
Cloud-based Tableau Developer
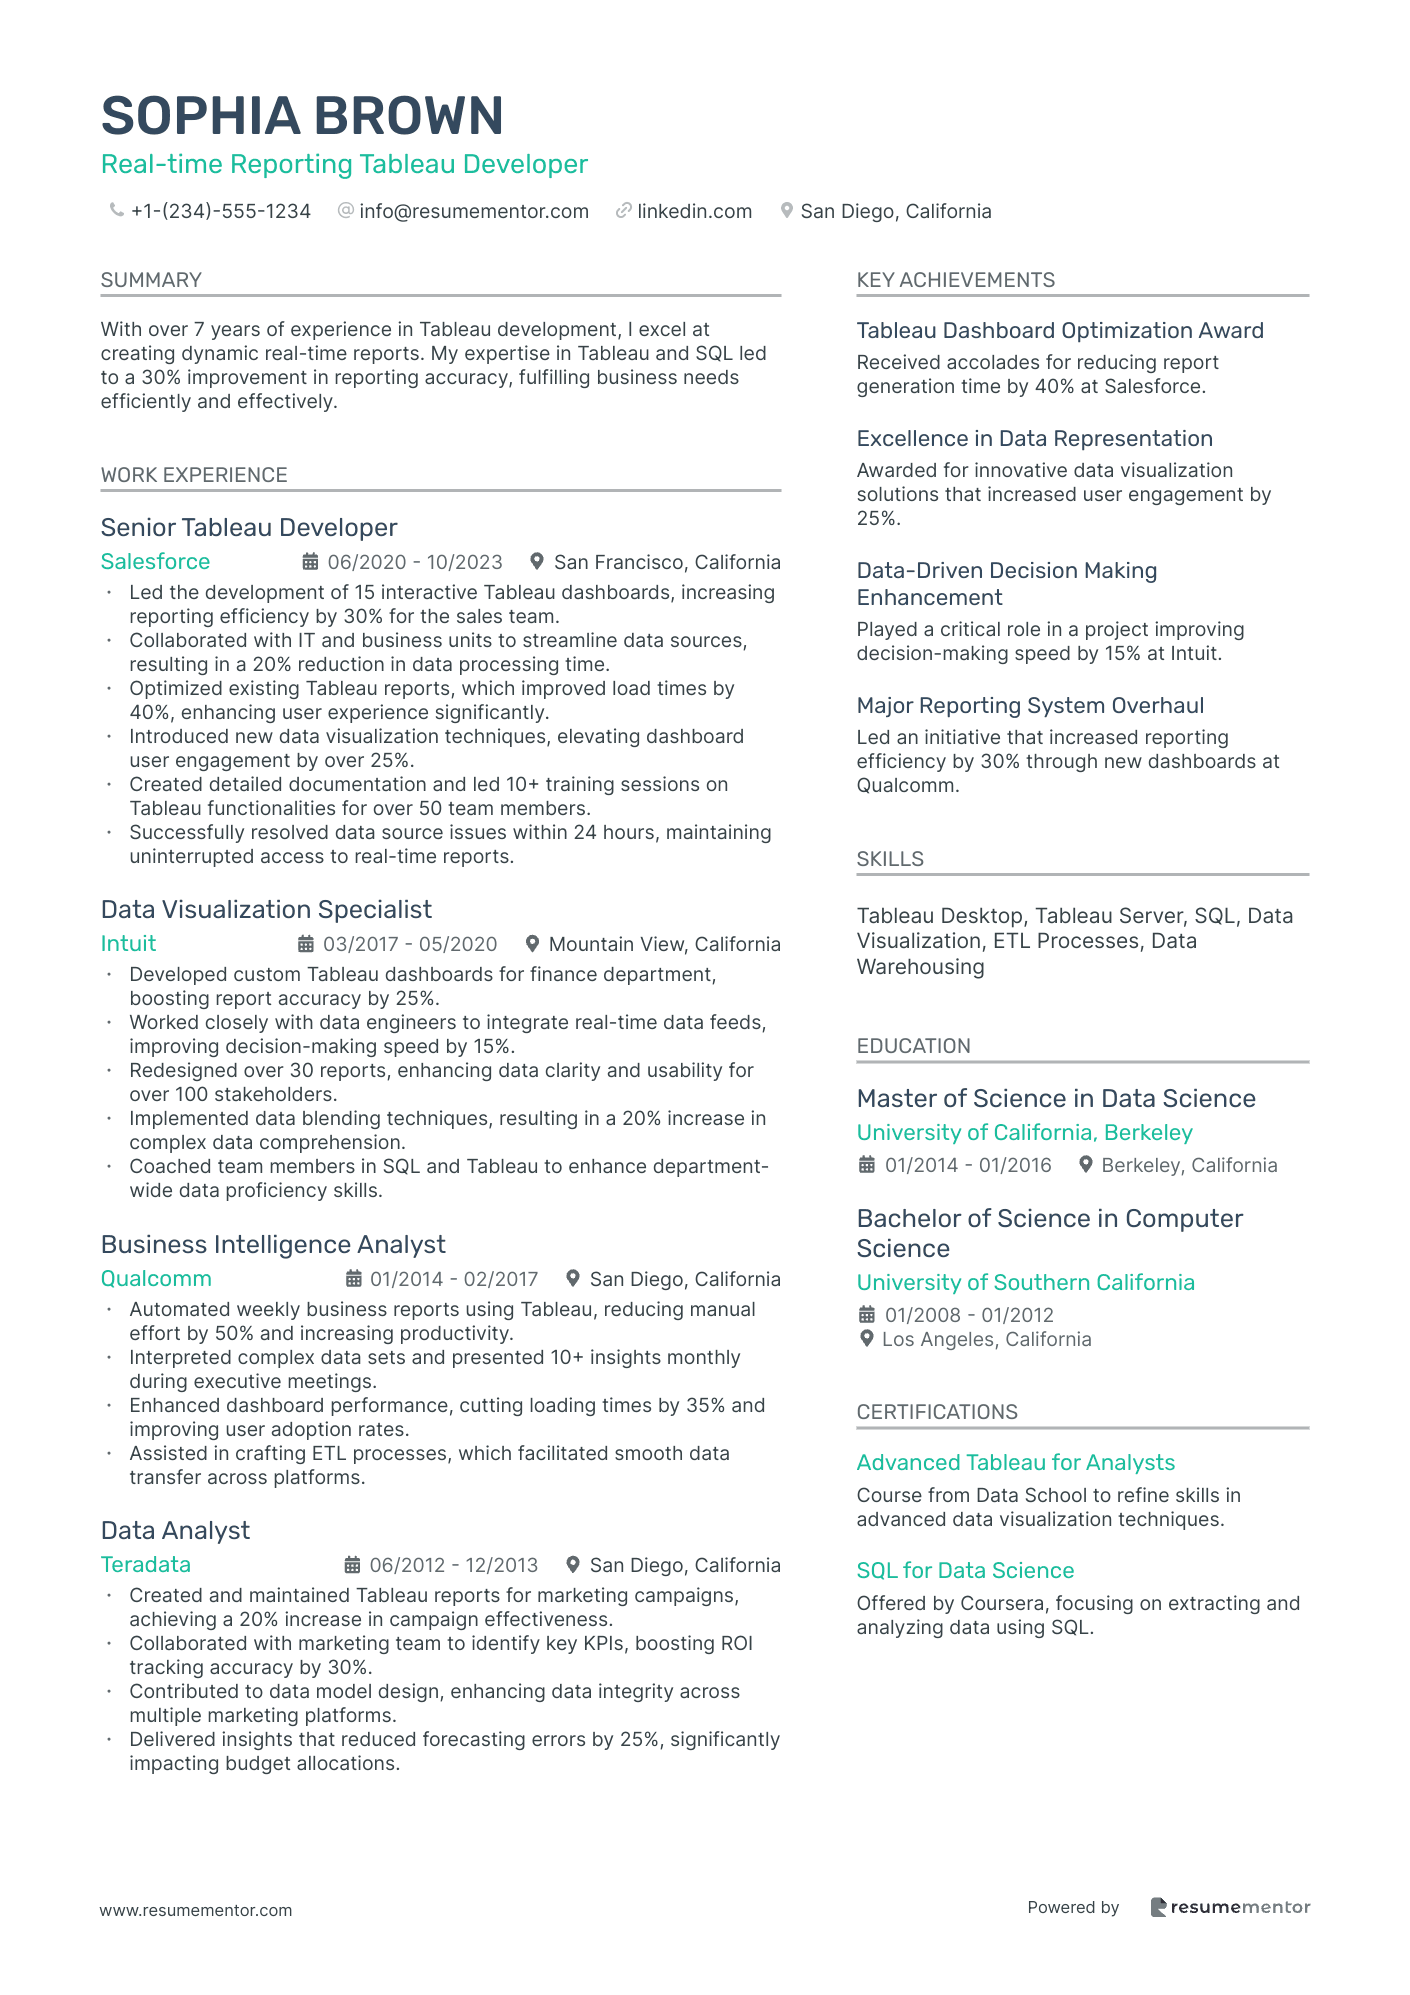
Real-time Reporting Tableau Developer
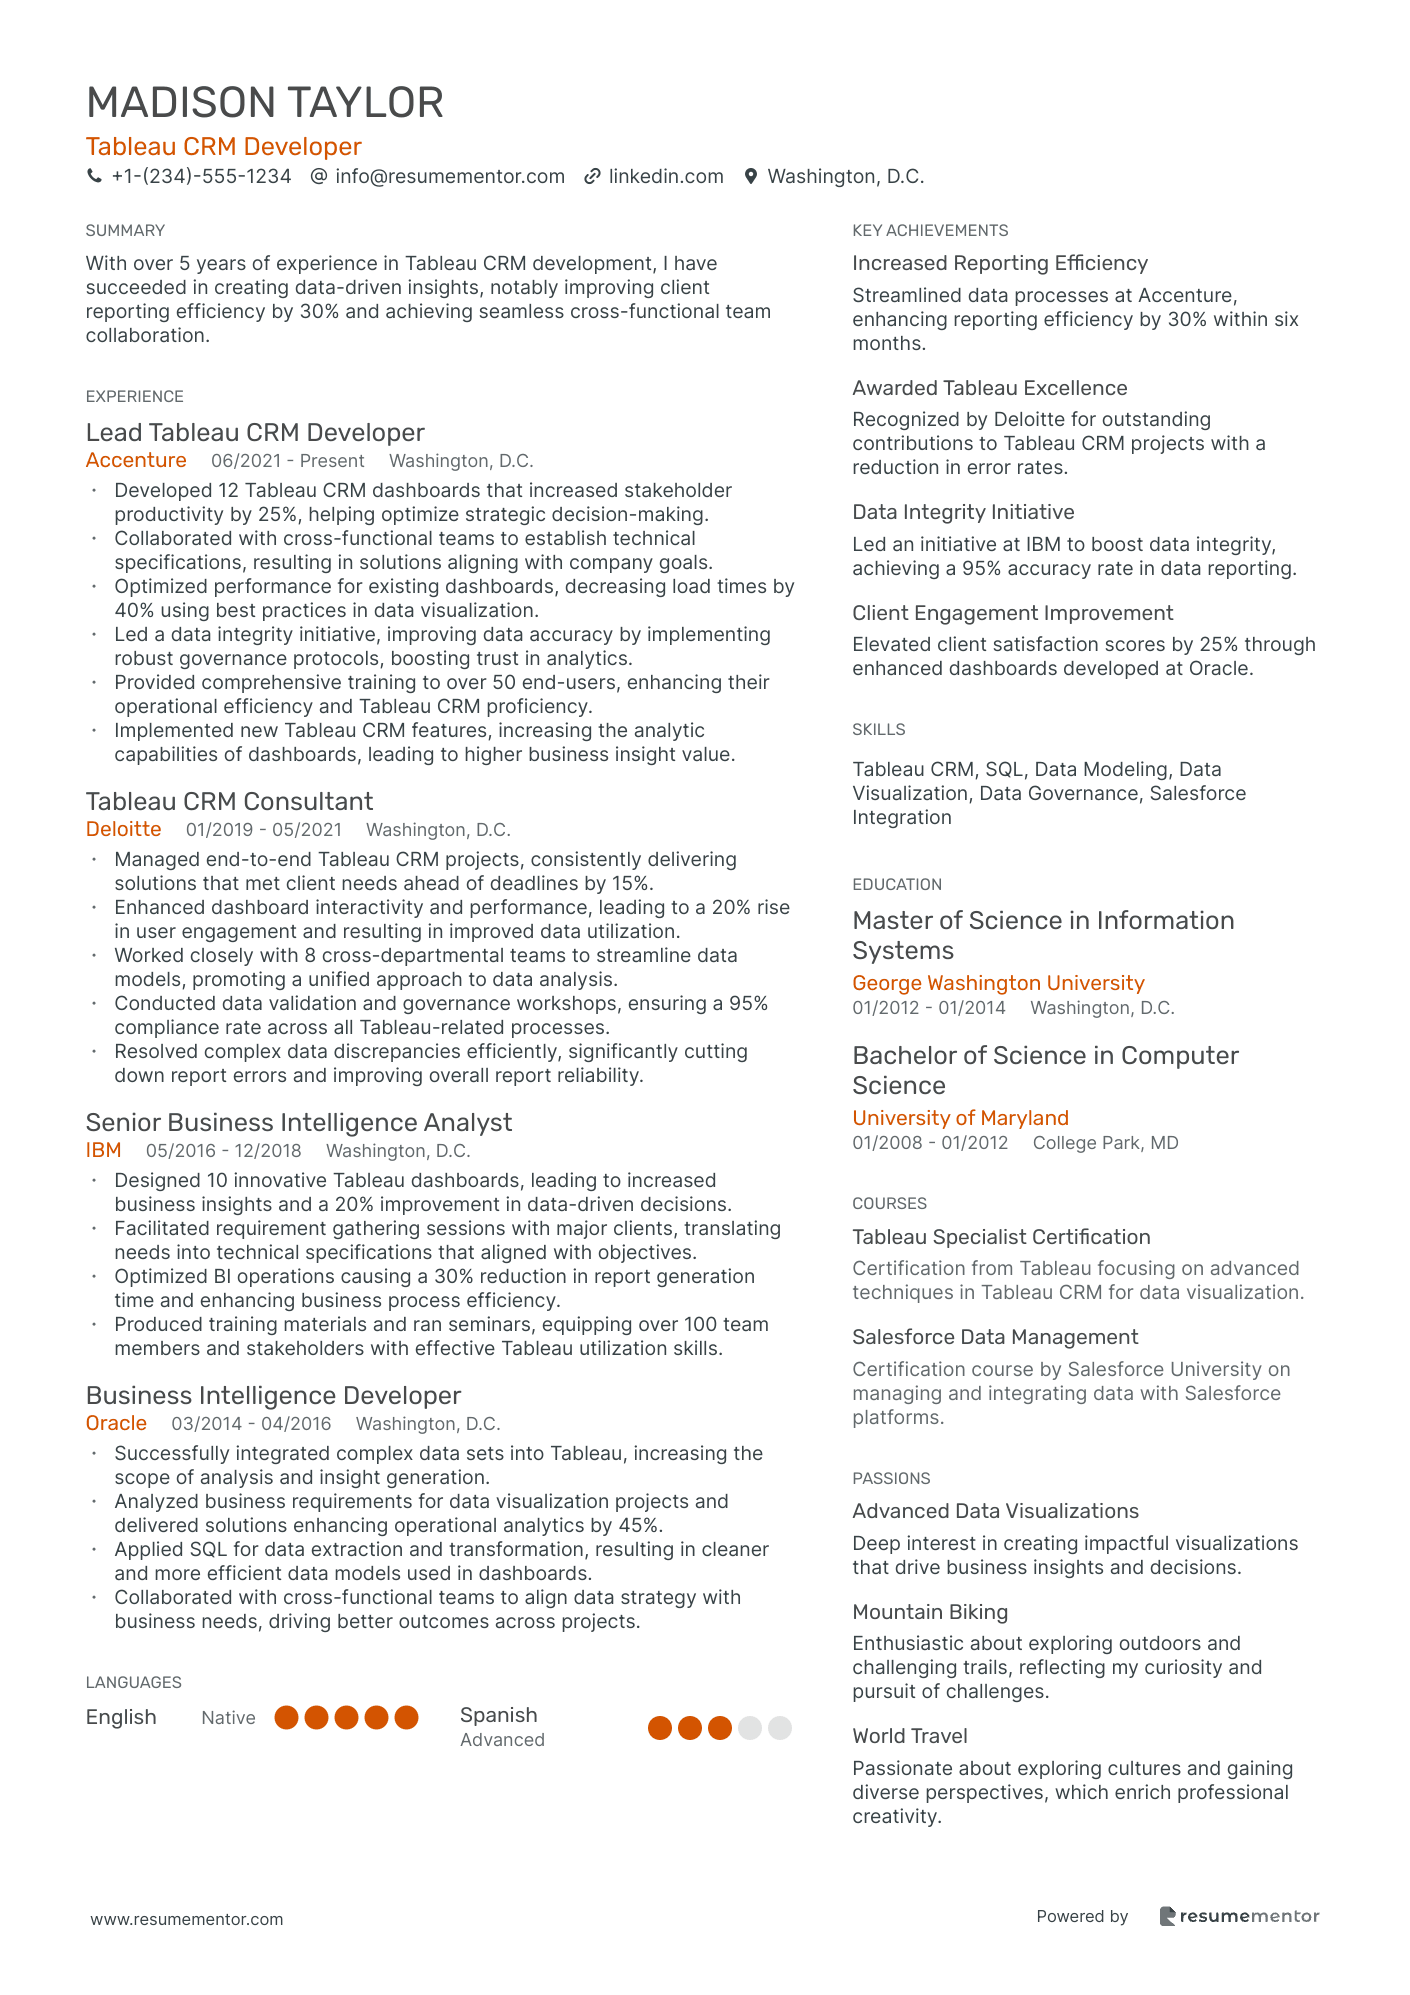
Tableau CRM Developer
Machine Learning Focused Tableau Developer

Tableau Data Visualization Developer resume sample
- •Designed and implemented over 50 interactive dashboards, increasing data-driven decision-making by 35% for cross-functional teams.
- •Collaborated with stakeholders to gather requirements, resulting in an 80% satisfaction rate with dashboard usability and clarity.
- •Led the team in developing best practices for data visualization that improved dashboard consistency and accessibility by 25%.
- •Resolved complex data visualization issues, reducing troubleshooting time by 40% and ensuring seamless dashboard operations.
- •Analyzed complex data sets to identify trends, providing actionable insights that contributed to a 20% increase in sales.
- •Trained and mentored team members on Tableau techniques, resulting in a 50% improvement in team efficiency.
- •Built and managed 100+ data models and sources for Tableau dashboards, enhancing data accuracy by 30%.
- •Pioneered new data visualization strategies that improved business insight delivery speed by 40%.
- •Collaborated closely with IT and business teams to understand needs and improve data representation by 60%.
- •Created dashboards that identified market trends, helping reduce cost overruns by 15% through actionable insights.
- •Ensured data integrity across visuals, decreasing data discrepancy rates by 25% through efficient data validation.
- •Developed and maintained key visual dashboards, supporting business intelligence initiatives and increasing reporting efficiency by 20%.
- •Enhanced data source integration, improving data refresh times by 50% through advanced ETL techniques.
- •Produced visual reports that facilitated executive-level decision-making, contributing to a 10% increase in revenue.
- •Standardized visualization formats and templates, reducing template creation time by 30% across departments.
- •Constructed comprehensive visuals and analytics, directly aiding in a 15% improvement in operational efficiency.
- •Integrated and cleaned complex datasets, ensuring 99% data accuracy in all visual representations.
- •Collaborated in a multi-functional team to deliver insights, increasing project success rates by 25%.
- •Facilitated workshops on data analysis tools, improving staff Tableau proficiency by 40%.
Tableau Business Intelligence Developer resume sample
- •Developed 20+ interactive dashboards for key departments, increasing data insight accessibility by 30%.
- •Collaborated closely with executives to provide data visualization solutions, enhancing strategic decision-making by 25%.
- •Integrated data from multiple sources into Tableau, ensuring data integrity that resulted in accurate insights alignment.
- •Documented complex data systems and processes, increasing team efficiency by facilitating easier onboarding.
- •Led a team of 5 in ETL processes, reducing data load errors by 40% through improved validation techniques.
- •Worked with IT to implement data governance protocols, improving data reliability by 20%.
- •Created a series of dashboards for sales departments, which boosted forecast accuracy by 25%.
- •Streamlined data transformation processes, decreasing processing time by 15% through optimized SQL queries.
- •Played a pivotal role in stakeholder meetings, translating complex data needs into effective business intelligence tools.
- •Supervised the integration of new Tableau features, enhancing report capabilities and increasing stakeholder satisfaction by 20%.
- •Improved data consistency by collaborating with data management teams, leading to more reliable business insights.
- •Conducted comprehensive analysis, providing insights that led to a 10% decrease in operational costs.
- •Automated monthly reporting processes which saved 20 hours of manual labor per month.
- •Analyzed customer data trends for marketing campaigns resulting in a 15% increase in customer engagement rates.
- •Partnered with IT to enhance data extraction processes, decreasing data retrieval times by 25%.
- •Provided data-driven recommendations that improved client service delivery by 18%.
- •Developed dashboards in collaboration with cross-functional teams, aligning business objectives with data insights.
- •Simplified data reporting channels, which resulted in a 20% improvement in report turnaround time.
- •Led a client project to assess data utilization, resulting in optimized resource allocation.
Senior Tableau Developer resume sample
- •Led the design and implementation of 20+ complex Tableau dashboards, improving reporting efficiency by 50% and resulting in enhanced decision-making.
- •Collaborated with cross-functional teams to gather data requirements, leading to the visualization of critical business insights.
- •Developed an optimized data model that reduced dashboard load times by 35% and increased user satisfaction scores.
- •Conducted regular training sessions for over 100 end-users, improving their ability to interpret complex data with a 90% training satisfaction rate.
- •Introduced best practices in Tableau design principles, resulting in a 25% increase in stakeholder engagement with contextual data insights.
- •Worked closely with data engineers to ensure data accuracy, resulting in a 20% reduction in reporting errors.
- •Developed a series of dashboards to track and report on company KPIs, leading to a 40% increase in operational transparency.
- •Optimized SQL queries for data retrieval, reducing average query response time by 30% across various applications.
- •Provided strategic insights through data analysis, contributing to a 15% revenue increase by identifying new market opportunities.
- •Prepared comprehensive documentation for all Tableau projects, improving project onboarding time by 50%.
- •Assisted in data warehouse integration efforts, ensuring seamless operation of ETL processes and enhancing data reliability.
- •Analyzed sales data to uncover key trends, resulting in a 20% increase in market penetration strategy effectiveness.
- •Built Tableau dashboards that streamlined report generation, resulting in a 60% reduction in time spent on manual reporting tasks.
- •Collaborated with marketing teams to develop predictive models that helped in planning promotional campaigns.
- •Implemented a training program for 50+ users, resulting in enhanced user proficiency with Tableau software.
- •Collected and analyzed data sets, contributing to the development of a customer segmentation model that increased sales by 10%.
- •Created detailed monthly reports and visualizations to provide actionable insights to stakeholders, improving strategic decisions.
- •Maintained a data integrity project that reduced discrepancies and improved accuracy by 25% in monthly reports.
- •Engaged in data cleanup projects, ensuring high-quality datasets and enhancing the reliability of analytics.
Tableau and SQL Developer resume sample
- •Developed over 50 interactive dashboards using Tableau, enhancing data-driven decision-making across business units.
- •Optimized SQL queries, reducing dashboard load times by 40% and significantly improving user experience.
- •Collaborated with five department heads to gather reporting requirements and translated them into impactful visualizations.
- •Ensured data accuracy in all reports, resulting in a 99.9% validation rate against source data.
- •Trained over 100 end-users on Tableau tools, increasing overall adoption across the organization by 25%.
- •Led a successful migration to Tableau Online, enhancing accessibility and reporting capabilities for remote users.
- •Wrote complex SQL queries to analyze customer data, improving insights for five key product teams.
- •Reduced report generation times by 50% after refactoring and optimizing existing SQL scripts.
- •Worked with data engineering to streamline data flows, increasing data availability by 30%.
- •Identified and addressed data integrity issues, significantly improving the reliability of key business reports.
- •Enabled a more collaborative environment by integrating SQL analytics into team decision-making processes.
- •Delivered user-centric Tableau dashboards, leading to enhanced insights that drove a 20% increase in sales strategies.
- •Managed the full reporting lifecycle from requirements gathering to delivery, ensuring timely stakeholder inputs.
- •Implemented performance enhancements resulting in an average decrease of 30% in dashboard load times.
- •Fostered cross-department collaboration to align reporting strategies with business objectives efficiently.
- •Revamped data reporting techniques, elevating the report accuracy by 95% and supporting informed strategic decisions.
- •Analyzed complex datasets to present data-driven insights, contributing to operational initiatives.
- •Collaborated across multiple teams to design and implement structured data solutions.
- •Developed SQL-based automated reports that reduced manual analysis by 15 hours monthly.
Tableau Developer with Python Expertise resume sample
- •Led the development of complex Tableau visualizations that enhanced decision-making, driving a 35% increase in data-driven projects.
- •Collaborated with cross-functional teams to automate data workflows using Python, reducing data processing time by 40%.
- •Designed interactive dashboards improving user experience, resulting in a 25% increase in user satisfaction ratings.
- •Optimized existing Tableau dashboards, achieving a performance boost of 30% through strategic redesign and performance tuning.
- •Integrated APIs with Tableau for dynamic data updates, increasing data refresh rates by 50% and improving real-time insights.
- •Trained over 50 team members on Tableau best practices, elevating overall data literacy across the department.
- •Developed sustainable data models with Tableau, contributing to a 20% annual growth in implementation efficiency.
- •Automated data extraction processes using Python scripts, leading to a reduction in manual errors by 45%.
- •Coordinated with IT and business units to define data visualization needs, facilitating more than 100 successful dashboard launches.
- •Implemented data security measures within Tableau for sensitive reports, improving compliance adherence by 15%.
- •Revamped outdated dashboards to provide new insights, increasing stakeholder engagement by 40%.
- •Analyzed complex datasets and transformed them into simplified visuals, supporting a 25% increase in team analytics skills.
- •Utilized SQL and Python to develop predictive models, aiding in strategic decision-making processes for key stakeholders.
- •Conducted weekly training sessions on dashboard analytics, boosting team efficiency in data handling by 30%.
- •Collaborated on a successful project that streamlined data reporting tools, cutting down project delivery time by 20%.
- •Supported the migration of legacy reports to Tableau, enhancing report availability by 60% across various departments.
- •Optimized reporting architectures, leading to improved data accessibility and a 35% reduction in data retrieval times.
- •Integrated multiple data sources for comprehensive analysis, increasing user base by 15% with new dashboard offerings.
- •Identified key performance trends through data visualization solutions, boosting overall financial analysis accuracy by 10%.
Tableau Developer for Finance resume sample
- •Developed over 25 interactive Tableau dashboards that streamlined financial reporting, reducing report generation time by 30%.
- •Collaborated closely with finance teams to translate complex financial data into actionable insights, enhancing organizational decision-making processes.
- •Enhanced data integrity by implementing advanced data preparation techniques, resulting in a 45% reduction in data inaccuracies.
- •Trained and mentored over 20 finance professionals in Tableau best practices, leading to significantly improved user adoption rates.
- •Executed a comprehensive dashboard performance optimization project, improving loading times by 50% across all platforms.
- •Led an initiative to incorporate new Tableau functionalities, integrating real-time data visuals and boosting user engagement by 35%.
- •Designed dynamic Tableau reports and visualization solutions, increasing department decision-making speed by 25%.
- •Worked cross-functionally with data management teams to enhance data extraction processes, improving data consistency by 40%.
- •Implemented new data modeling techniques, resulting in more accurate and reliable financial forecasting models.
- •Optimized existing reports for performance clarity, reducing clutter and increasing report usability by 20%.
- •Collaborated with IT to integrate SQL-based solutions into Tableau, expanding available datasets for more comprehensive analysis.
- •Developed and maintained over 15 dashboards supporting key financial metrics, leading to improved monthly performance reviews.
- •Assisted finance teams in leveraging data analytics for strategic pricing strategies, contributing to a 12% revenue uptick.
- •Regularly conducted comprehensive data audits, enhancing reporting accuracy and eliminating data discrepancies by 30%.
- •Trained 10 employees in new data visualization tools, significantly increasing team productivity and reporting efficiency.
- •Compiled complex data into clear, actionable insights, increasing reporting timeline efficiency by 15%.
- •Led the migration to more robust analytical tools, resulting in enhanced data processing capabilities and reduced manual workload.
- •Collaborated with financial analysts to develop predictive models, contributing to a 10% improvement in forecasting accuracy.
- •Automated data extraction processes using SQL, reducing manual data handling errors by 25%.
Cloud-based Tableau Developer resume sample
- •Designed and implemented 20+ interactive dashboards resulting in a 30% increase in stakeholder decision-making speed.
- •Collaborated with finance and marketing teams to translate business requirements into technical solutions.
- •Optimized existing reports and dashboards increasing loading times by 50% utilizing Tableau Online and AWS.
- •Extracted and transformed data from multiple cloud sources cleaning over 500,000 records for improved accuracy.
- •Provided end-user training, enhancing team data fluency by 25% through comprehensive workshops.
- •Created documentation standards for the team leading to a 15% reduction in onboarding times.
- •Developed 15 high-performance dashboards for sales, achieving a 20% improvement in data accessibility.
- •Collaborated with cross-departmental teams for strategic insights collection, leading to enhanced communication.
- •Ensured data integrity through governance policies, decreasing error rates by 30% across reporting systems.
- •Stayed updated on Tableau features, implementing them to enhance analytical reprt capability by 40%.
- •Supported end-users, improving their data interpretation skills by conducting interactive training sessions.
- •Designed custom reports using SQL and Tableau for management, improving report delivery speed by 35%.
- •Analyzed sales data, resulting in strategies that increased annual revenue by 25% through targeted insights.
- •Led a data cleansing initiative, correcting 50,000 records which improved data reliability by 60%.
- •Implemented dashboard optimizations that reduced user query response time by 40% on Tableau Server.
- •Analyzed complex data sets to help identify sales trends, increasing quarterly sales by 10% through data insights.
- •Created detailed visualizations in Tableau, enhancing marketing team's ability to predict consumer behavior.
- •Cleaned and formatted data from various sources, significantly decreasing data redundancies by 20%.
- •Worked with data warehousing experts to integrate a new database, improving data retrieval speed by 25%.
Real-time Reporting Tableau Developer resume sample
- •Led the development of 15 interactive Tableau dashboards, increasing reporting efficiency by 30% for the sales team.
- •Collaborated with IT and business units to streamline data sources, resulting in a 20% reduction in data processing time.
- •Optimized existing Tableau reports, which improved load times by 40%, enhancing user experience significantly.
- •Introduced new data visualization techniques, elevating dashboard user engagement by over 25%.
- •Created detailed documentation and led 10+ training sessions on Tableau functionalities for over 50 team members.
- •Successfully resolved data source issues within 24 hours, maintaining uninterrupted access to real-time reports.
- •Developed custom Tableau dashboards for finance department, boosting report accuracy by 25%.
- •Worked closely with data engineers to integrate real-time data feeds, improving decision-making speed by 15%.
- •Redesigned over 30 reports, enhancing data clarity and usability for over 100 stakeholders.
- •Implemented data blending techniques, resulting in a 20% increase in complex data comprehension.
- •Coached team members in SQL and Tableau to enhance department-wide data proficiency skills.
- •Automated weekly business reports using Tableau, reducing manual effort by 50% and increasing productivity.
- •Interpreted complex data sets and presented 10+ insights monthly during executive meetings.
- •Enhanced dashboard performance, cutting loading times by 35% and improving user adoption rates.
- •Assisted in crafting ETL processes, which facilitated smooth data transfer across platforms.
- •Created and maintained Tableau reports for marketing campaigns, achieving a 20% increase in campaign effectiveness.
- •Collaborated with marketing team to identify key KPIs, boosting ROI tracking accuracy by 30%.
- •Contributed to data model design, enhancing data integrity across multiple marketing platforms.
- •Delivered insights that reduced forecasting errors by 25%, significantly impacting budget allocations.
Tableau CRM Developer resume sample
- •Developed 12 Tableau CRM dashboards that increased stakeholder productivity by 25%, helping optimize strategic decision-making.
- •Collaborated with cross-functional teams to establish technical specifications, resulting in solutions aligning with company goals.
- •Optimized performance for existing dashboards, decreasing load times by 40% using best practices in data visualization.
- •Led a data integrity initiative, improving data accuracy by implementing robust governance protocols, boosting trust in analytics.
- •Provided comprehensive training to over 50 end-users, enhancing their operational efficiency and Tableau CRM proficiency.
- •Implemented new Tableau CRM features, increasing the analytic capabilities of dashboards, leading to higher business insight value.
- •Managed end-to-end Tableau CRM projects, consistently delivering solutions that met client needs ahead of deadlines by 15%.
- •Enhanced dashboard interactivity and performance, leading to a 20% rise in user engagement and resulting in improved data utilization.
- •Worked closely with 8 cross-departmental teams to streamline data models, promoting a unified approach to data analysis.
- •Conducted data validation and governance workshops, ensuring a 95% compliance rate across all Tableau-related processes.
- •Resolved complex data discrepancies efficiently, significantly cutting down report errors and improving overall report reliability.
- •Designed 10 innovative Tableau dashboards, leading to increased business insights and a 20% improvement in data-driven decisions.
- •Facilitated requirement gathering sessions with major clients, translating needs into technical specifications that aligned with objectives.
- •Optimized BI operations causing a 30% reduction in report generation time and enhancing business process efficiency.
- •Produced training materials and ran seminars, equipping over 100 team members and stakeholders with effective Tableau utilization skills.
- •Successfully integrated complex data sets into Tableau, increasing the scope of analysis and insight generation.
- •Analyzed business requirements for data visualization projects and delivered solutions enhancing operational analytics by 45%.
- •Applied SQL for data extraction and transformation, resulting in cleaner and more efficient data models used in dashboards.
- •Collaborated with cross-functional teams to align data strategy with business needs, driving better outcomes across projects.
Machine Learning Focused Tableau Developer resume sample
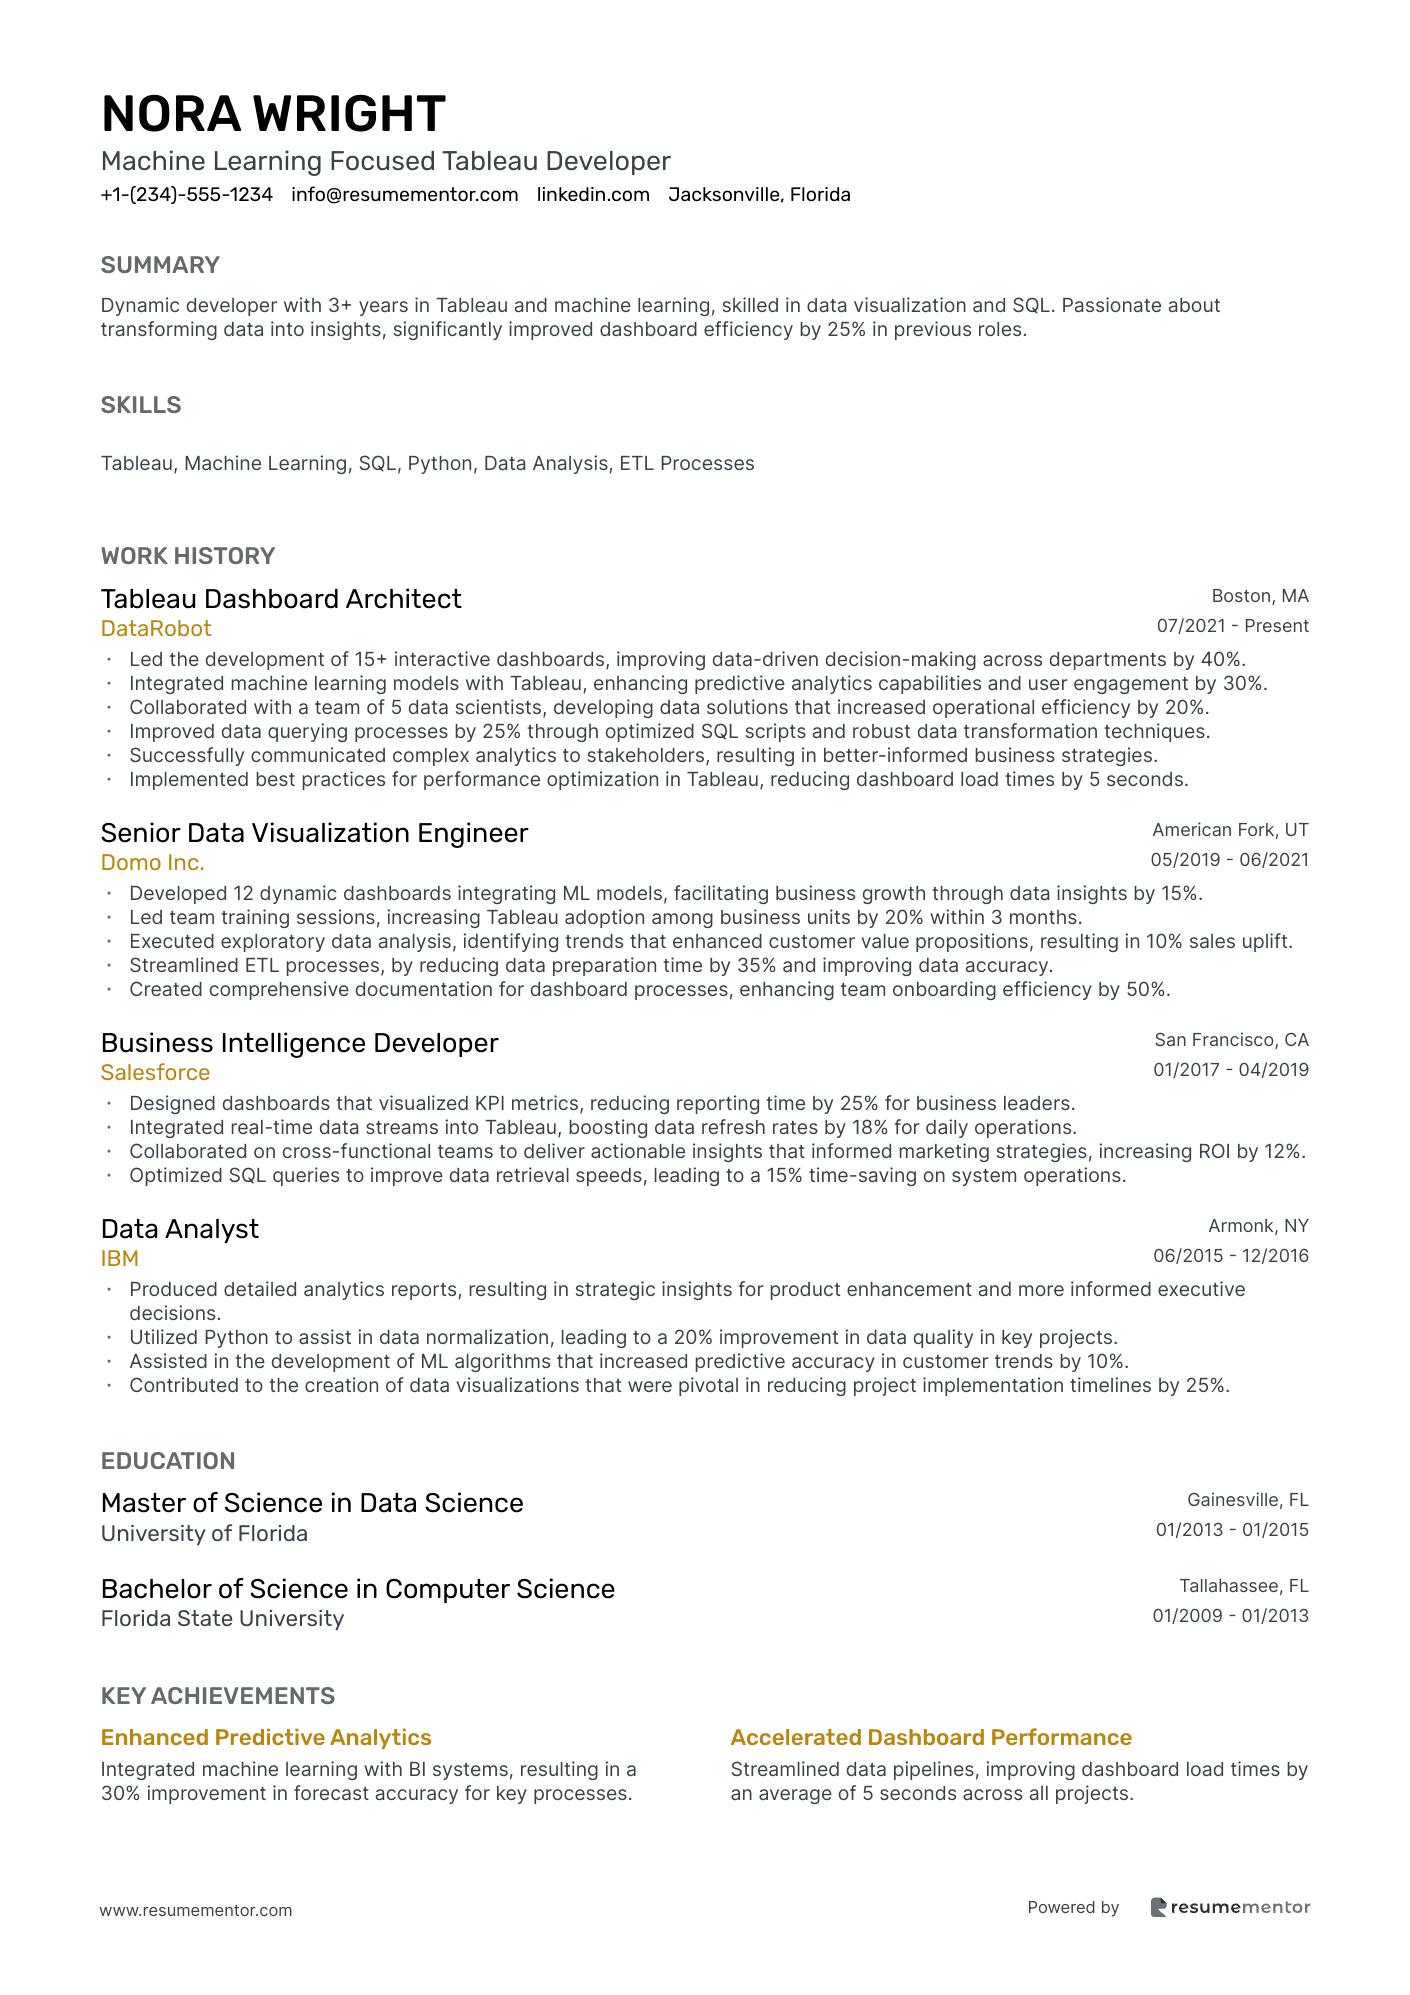
- •Led the development of 15+ interactive dashboards, improving data-driven decision-making across departments by 40%.
- •Integrated machine learning models with Tableau, enhancing predictive analytics capabilities and user engagement by 30%.
- •Collaborated with a team of 5 data scientists, developing data solutions that increased operational efficiency by 20%.
- •Improved data querying processes by 25% through optimized SQL scripts and robust data transformation techniques.
- •Successfully communicated complex analytics to stakeholders, resulting in better-informed business strategies.
- •Implemented best practices for performance optimization in Tableau, reducing dashboard load times by 5 seconds.
- •Developed 12 dynamic dashboards integrating ML models, facilitating business growth through data insights by 15%.
- •Led team training sessions, increasing Tableau adoption among business units by 20% within 3 months.
- •Executed exploratory data analysis, identifying trends that enhanced customer value propositions, resulting in 10% sales uplift.
- •Streamlined ETL processes, by reducing data preparation time by 35% and improving data accuracy.
- •Created comprehensive documentation for dashboard processes, enhancing team onboarding efficiency by 50%.
- •Designed dashboards that visualized KPI metrics, reducing reporting time by 25% for business leaders.
- •Integrated real-time data streams into Tableau, boosting data refresh rates by 18% for daily operations.
- •Collaborated on cross-functional teams to deliver actionable insights that informed marketing strategies, increasing ROI by 12%.
- •Optimized SQL queries to improve data retrieval speeds, leading to a 15% time-saving on system operations.
- •Produced detailed analytics reports, resulting in strategic insights for product enhancement and more informed executive decisions.
- •Utilized Python to assist in data normalization, leading to a 20% improvement in data quality in key projects.
- •Assisted in the development of ML algorithms that increased predictive accuracy in customer trends by 10%.
- •Contributed to the creation of data visualizations that were pivotal in reducing project implementation timelines by 25%.
Crafting your resume as a Tableau developer is much like building a complex visualization—connecting ideas to form a clear picture. Your data skills are impressive, but articulating them in words can be tricky. Employers look for both your technical expertise with Tableau and your ability to communicate those skills effectively.
The challenge of highlighting your skills while maintaining a concise and engaging resume is common. However, clarity and organization are essential to making an impact. Since hiring managers spend only seconds on each application, grabbing their attention quickly is crucial. Here, using a well-structured resume template can help your content be both organized and visually appealing.
Think of your resume layout as another canvas where you showcase your talent, similar to the dashboards you create. It should weave together the story of your professional journey without becoming overwhelming. By avoiding technical jargon that can obscure your achievements, you ensure your true capabilities shine through.
Your resume needs to do more than list job duties; it should illustrate how you transform data into insights, solve problems, and drive decisions. As you craft your resume, make sure it highlights your distinctive perspective on data. When done right, your resume becomes a powerful tool that helps you stand out in the competitive landscape of data visualization. To get started on structuring your resume effectively, explore these resume templates.
Key Takeaways
- Effectively formatting and organizing your resume, similar to designing a clear Tableau dashboard, helps capture hiring managers' attention quickly.
- Highlight your technical expertise with Tableau along with your problem-solving ability to transform data into actionable insights.
- Include quantifiable achievements in your work experience to illustrate your impact on previous employers, emphasizing teamwork and problem-solving.
- Complement your technical skills with soft skills in communication and adaptability, showcasing your ability to convey data insights effectively.
- Incorporate additional sections such as certifications, languages, and volunteer work to present a well-rounded and engaging professional profile.
What to focus on when writing your tableau developer resume
A Tableau developer resume should effectively communicate your proficiency in data visualization and your ability to transform data into actionable insights using Tableau. Highlighting your analytical skills and collaborative efforts can demonstrate your impact on data-driven decisions within a team.
How to structure your tableau developer resume
- Contact Information: Start with your full name, phone number, email address, and LinkedIn profile—ensuring recruiters can easily reach out to you. A clear and professional email address adds credibility, while including your LinkedIn profile allows you to provide additional context about your professional journey, making your digital presence aligned with your resume.
- Professional Summary: Next, capture your Tableau expertise by summarizing your years of experience and key skills. This section should convey not just what you've done, but how you've consistently used Tableau to drive business success. Highlight any specific industries you've worked in, as domain knowledge can be a plus. Briefly mentioning an outstanding achievement with quantitative results can make your summary memorable and impactful.
- Technical Skills: It’s crucial to mention specific skills pertinent to a Tableau developer, such as proficiency in Tableau Desktop, Tableau Server, SQL, and data modeling. Acknowledge any experience you have with integrating these tools within larger business intelligence frameworks, which can set you apart. Highlighting skills with analytical languages like R or Python can also signify your versatility and ability to handle complex data challenges.
- Work Experience: When detailing your work history, focus on roles where you've used Tableau to address business challenges. Describe not only what you achieved but how your efforts contributed to the company’s goals. Discuss projects where the data you presented led to strategic decision-making, reduced costs, or improved efficiency. This provides concrete examples of your ability to transform data into actionable insights.
- Education: Continuing with your educational background, draw a connection between your degrees in computer science, statistics, or related fields and your capabilities as a Tableau developer. If you completed any relevant coursework or projects during your studies, mentioning these can bolster your foundation. This shows recruiters that your technical knowledge is both theoretical and practical.
- Certifications: Conclude with any Tableau certifications, like Tableau Desktop Specialist or Tableau Certified Professional, that reinforce your expertise. Highlighting recent certifications can indicate that you’re committed to staying current with evolving technology, which is crucial in the fast-paced world of data analytics. Such qualifications demonstrate a formal recognition of your skills.
Understanding how to effectively structure your resume is essential—below we'll cover each section in more depth.
Which resume format to choose
As a Tableau developer, selecting the right resume format is essential for effectively presenting your experience. The reverse-chronological format is ideal, as it emphasizes your most recent and relevant work first—a critical aspect in a tech-driven field. This format showcases your growth and achievements over time, making it easier for potential employers to follow your career trajectory.
In terms of fonts, choosing a modern typeface is crucial for a professional appearance. Montserrat offers a clean and contemporary look, while Lato gives balance and readability to your text. Raleway, with its elegant design, ensures that your headings draw attention without overwhelming the reader. These font choices contribute to a polished resume that stands out in a competitive tech landscape.
Saving your resume as a PDF is non-negotiable. This filetype preserves your formatting, ensuring your resume looks the same on any device or operating system. As hiring managers review numerous resumes, a consistent and professional presentation can make a significant difference.
Using one-inch margins on all sides is another important detail. This choice creates a tidy layout with ample whitespace, enhancing readability and keeping your resume from feeling cramped. It helps frame your content, giving it a clean and professional look that makes it easier for employers to focus on your qualifications and accomplishments.
Together, these aspects create a comprehensive guide to crafting a compelling resume tailored to your career as a Tableau developer, ensuring that you make a strong and lasting impression.
How to write a quantifiable resume experience section
A strong experience section is essential for standing out as a Tableau Developer, focusing on clear achievements that align with your target job. Organize your entries starting with the most recent roles, typically covering the last 10-15 years, unless a previous position is especially relevant. Highlight job titles that match the role you want, naturally integrating keywords and skills from the job ad. Using action words like "developed," "implemented," and "optimized" can effectively illustrate your contributions.
Here's an enhanced example for a Tableau Developer:
 05/2020 - 08/2023
- •Created over 50 Tableau dashboards, speeding up decision-making by 30%.
- •Worked with a team to streamline business analysis, reducing reporting time by 40%.
- •Enhanced data processes, boosting processing efficiency by 20%.
- •Led Tableau training for 80+ staff, improving company data literacy.
In this example, achievements are clearly quantified, using action words that convey energy and effectiveness, and seamlessly connect your role's impact. Each point builds on your expertise, demonstrating a coherent narrative aligned with the skills employers seek. The chronological order presents a clear career progression, showing how your roles and contributions have evolved, positioning you as a valuable asset ready to make a difference.
Problem-Solving Focused resume experience section
A problem-solving-focused Tableau Developer resume experience section should emphasize your ability to turn data into solutions that drive business success. Start by clearly stating your job titles and the dates you worked in those roles, followed by bullet points that highlight your expertise in identifying issues and implementing data-driven solutions through Tableau. It's important to showcase the positive impact of your efforts and how they contributed to the organization’s goals.
Your bullet points should be easy to read and relate to each other, forming a narrative of your problem-solving journey. Use straightforward language to describe your achievements, such as when your Tableau dashboards led to significant improvements in efficiency or when you collaborated with teams to tailor data visualizations to meet specific business needs. Wherever possible, quantify these accomplishments to give a clear picture of your impact, creating a comprehensive view of your capabilities.
Tableau Developer
Tech Innovators Inc.
Jan 2020 - Sep 2023
- Transformed raw data into actionable insights, enhancing decision-making for marketing strategies.
- Designed interactive dashboards that cut report generation time by 30%, streamlining processes.
- Partnered with cross-functional teams to understand business needs and develop tailored visualizations.
- Identified and resolved data discrepancies, increasing data accuracy by 15%.
Project-Focused resume experience section
A project-focused Tableau Developer resume experience section should clearly highlight the significant projects you've taken on and your contributions to each. Describe these projects in terms of how they improved decision-making and efficiency, focusing on your role and the outcomes. Use specific metrics to illustrate your success, like accelerating data processing or boosting user satisfaction with dashboards.
Each bullet point should kick off with a powerful action verb that showcases your skills and achievements. Provide details on the technologies you used and challenges you overcame, as this demonstrates problem-solving abilities. Keeping the language straightforward ensures easy readability, and numbers can effectively illustrate the scale and impact of your contributions.
Tableau Developer
Tech Innovations Corp
March 2021 - Present
- Led a team of three in crafting interactive dashboards that made data accessible for over 200 users, improving overall data engagement.
- Utilized Tableau to implement advanced analytics solutions, which increased decision-making speed by 30% for key stakeholders.
- Worked closely with IT and business units to gather and refine requirements for custom visualizations, boosting report accuracy by 25%.
- Conducted training sessions for 50 staff, enhancing their Tableau skills and reducing reporting errors by 15%.
Collaboration-Focused resume experience section
A collaboration-focused Tableau developer resume experience section should emphasize how effectively you work within teams and the impact of your efforts on project outcomes. Start by describing your job role and the company's structure to establish the significance of teamwork in your achievements. Use well-crafted bullet points that not only showcase your collaborative efforts but also highlight the tangible results you've achieved. Contextualize each point by demonstrating how working alongside others led to improved processes, successful deliveries, or enhanced team efficiency.
Ensure that your narrative flows seamlessly by beginning each bullet with a dynamic action verb that captures your role in teamwork. Highlight how you partnered with team members to tackle complex challenges or exceed client expectations. Detail any situations where your ability to collaborate drove cost-efficiency, expedited project timelines, or aligned with broader company objectives. This approach cohesively illustrates your teamwork proficiency and dedication to achieving shared goals in your positions.
Tableau Developer
Tech Solutions Inc.
May 2020 - Present
- Partnered with data scientists to design interactive dashboards improving analytical capabilities for sales teams.
- Coordinated with UI/UX designers to enhance user experience and ensure data insights are easily accessible and actionable.
- Conducted regular team workshops to share best practices, leading to a 20% increase in productivity.
- Worked closely with project managers to meet tight deadlines, resulting in project delivery 10% faster than anticipated.
Efficiency-Focused resume experience section
An efficiency-focused Tableau Developer resume experience section should vividly highlight how your work has made a meaningful difference in your role. Begin by discussing the specific skills and tools you've utilized to boost efficiency, emphasizing your ability to streamline workflows for better outcomes. Explain how your efforts reduced redundancies and sped up processes, showcasing leadership or innovation in tasks or projects. Illustrate how these actions have enhanced productivity and improved the accuracy of data visualization.
Active language is essential for emphasizing the personal impact and responsibilities you carried. Swap vague descriptions for concrete numbers or outcomes that effectively demonstrate your influence and initiative. Quantify your achievements wherever possible, offering a clear picture of how you turned challenges into problem-solving opportunities. Conclude by mentioning relevant Tableau functions or features you've managed or introduced, giving context to your accomplishments and painting a full picture of your expertise.
Tableau Developer
Data Solutions Inc.
2019-2023
- Streamlined data workflows, leading to a 40% reduction in data processing time.
- Automated reporting processes saving the company 5 work hours per week.
- Developed interactive dashboards that improved user access to real-time data, boosting decision-making speed by 25%.
- Trained team members in best practices for data visualization, enhancing overall team efficiency.
Write your tableau developer resume summary section
A data-focused Tableau Developer resume summary should capture your skills fluently and make a strong impression. Start by clearly stating your experience level and then highlight your most significant achievements. Detail how long you've worked in the industry, focusing on specific skills that make you shine. Tailor this information to fit the position you're targeting. Consider this example:
This summary not only highlights your experience but also underscores specific skills, offering a clear picture of your capabilities. When describing yourself, it’s crucial to emphasize qualities like adaptability and problem-solving prowess, showcasing the value you bring to a potential employer.
Understanding the difference between a resume summary and a resume objective is also key. A summary emphasizes past achievements, ideal for seasoned Tableau developers, while a resume objective outlines career goals, fitting for newer candidates. A resume profile elegantly blends achievements with future aspirations, whereas a summary of qualifications lists key competencies in bullet points. Each format serves a unique purpose, reflecting your career stage and enhancing how you present yourself on paper.
Listing your tableau developer skills on your resume
A Tableau-focused resume skills section should effectively highlight your abilities and strengths, clearly showcasing what you bring to the table. You can either dedicate a standalone section to skills for clear presentation or integrate your skills into the experience and summary sections to demonstrate real-life application. Your strengths are key qualities, encompassing a mix of hard and soft skills. Soft skills, such as communication and teamwork, help you connect and collaborate with others. In contrast, hard skills are specific technical competencies like mastering Tableau software or conducting thorough data analysis.
Incorporating your skills and strengths as keywords can make your resume more visible to hiring managers and align you more closely with the job description. This strategic use of keywords not only highlights what you can do but also positions you as a top candidate for the role.
Here’s an example of how a standalone skills section could be structured:
This skills section is effective because of its focus and relevance. It helps hiring managers and resume-scanning software quickly grasp your capabilities by listing essential skills that define a successful Tableau developer.
Best hard skills to feature on your tableau developer resume
For a Tableau developer, hard skills demonstrate your technical prowess and ability to manage and visualize data, build dashboards, and support business intelligence functions. They underline your expertise and readiness for the role.
Hard Skills
- Tableau Desktop
- Tableau Server
- Data Visualization
- SQL
- ETL (Extract, Transform, Load) Processes
- Dashboard Design
- Data Warehousing
- R and Python Integration
- Business Intelligence (BI)
- Database Management
- Tableau Online
- Advanced Analytics
- Data Blending
- Calculated Fields
- Interactive Reporting
Best soft skills to feature on your tableau developer resume
Soft skills are equally vital for a Tableau developer, reflecting how you convey data insights and collaborate within a team. They illustrate your capacity to communicate effectively, adapt to changes, and solve challenges seamlessly.
Soft Skills
- Communication
- Teamwork
- Problem Solving
- Adaptability
- Attention to Detail
- Time Management
- Analytical Thinking
- Creativity
- Collaboration
- Interpersonal Skills
- Critical Thinking
- Empathy
- Negotiation
- Patience
- Flexibility
How to include your education on your resume
The education section of a resume holds significant weight, particularly because it underscores the foundation of your qualifications. It's essential to customize this section according to the specific job you're pursuing, omitting any unrelated education. When detailing your GPA, list it only if it adds value to your application — a GPA of 3.5 or above is typically considered beneficial. For honors like cum laude, include this distinction alongside your degree title. Write your degree clearly and concisely.
Below is an example of an incorrect resume education section:
09/2014 - 06/2018 Now here is an example of a well-crafted education section:
08/2015 - 05/2019 The second example is effective because it highlights a relevant degree for a Tableau Developer role and includes a noteworthy academic achievement. The cum laude distinction signals excellence, while the inclusion of a strong GPA further supports the candidate's competence. Tailoring the education section like this ensures the most pertinent details are showcased, aligning with the role's requirements.
How to include tableau developer certificates on your resume
Including a certificates section in your tableau developer resume is an important way to showcase your specialized skills and qualifications. Certificates can also be highlighted in the header for immediate visibility. List the name of the certificate first. Include the date you received the certificate. Add the issuing organization to validate the credential.
For example:
This example is good because it shows relevant certifications directly related to the skills needed for a tableau developer. The certificates are from recognized organizations, adding value to your qualifications. Listing these certificates in a dedicated section makes your resume more organized and easier for hiring managers to review. Additionally, including the issuer provides credibility to your skills and knowledge. Make sure you regularly update this section as you earn new certifications.
Extra sections to include in your tableau developer resume
Crafting a standout resume as a Tableau developer involves more than just listing your technical skills and job history. Including additional sections can enhance your profile and show off a more well-rounded personality, making you a more appealing candidate to potential employers.
Language section — List the languages you speak. It showcases communication skills and the ability to work in diverse teams or international settings.
Hobbies and interests section — Share activities you are passionate about outside of work. This provides a glimpse into your personality and can help build rapport with the hiring manager.
Volunteer work section — Highlight your community service or non-profit involvement. It demonstrates your character and willingness to give back to the community, which many employers value.
Books section — Mention books that have influenced your career or personal growth. It shows your commitment to continuous learning and can spark interesting conversations during interviews.
Including these sections in your resume presents you as a multifaceted individual. It goes beyond technical expertise and allows your passion, personality, cultural adaptability, and altruistic spirit to shine through.
In Conclusion
In conclusion, crafting an effective resume as a Tableau developer is akin to creating a dynamic data visualization—each element must serve a purpose and contribute to the overall impact. Your resume is not just a list of experiences; it's a narrative that highlights your technical skills, achievements, and contributions elegantly and concisely. Opt for a clear layout and reverse-chronological format to effectively showcase your growth and experiences, making it easy for potential employers to see your career trajectory. Choose modern fonts like Montserrat or Lato to reflect professionalism and ensure your resume is saved as a PDF to preserve formatting consistency.
When detailing your experience, focus on achievements and use quantifiable results to demonstrate your impact. Tailor your language to include action verbs and avoid technical jargon that could obscure your accomplishments. Use sections like education and certifications to reinforce your technical foundation, and make strategic use of keywords to align your resume with the job description. Extra sections such as languages, hobbies, and volunteer work can enrich your profile, giving hiring managers a glimpse into your character and personal interests.
By weaving together your technical competence with personal attributes, you create a compelling narrative that positions you as a standout candidate in the competitive world of data visualization. This well-crafted resume will not only grab attention but also leave a lasting impression, helping you advance in your career as a Tableau developer.
Related Articles

Continue Reading
Check more recommended readings to get the job of your dreams.
Resume
Resources
Tools
© 2026. All rights reserved.
Made with love by people who care.